What's new in AskiaAnalyse 5.4
We've listened to our clients and are proud to have incorporated many of their great suggestions into Analyse 5.4. The key new features are described in this article.
Contents
5.4.5
5.4.6
- Find option in portfolio and tab definition
- The search functionality extends to the universe and sub-population dropdown boxes
- New keywords
- Do not suppress option
- Add external data to portfolio
- Calculation arithmetic to pass string calcs
- Version and file location
- Run weightings with mixed levels
5.4.8
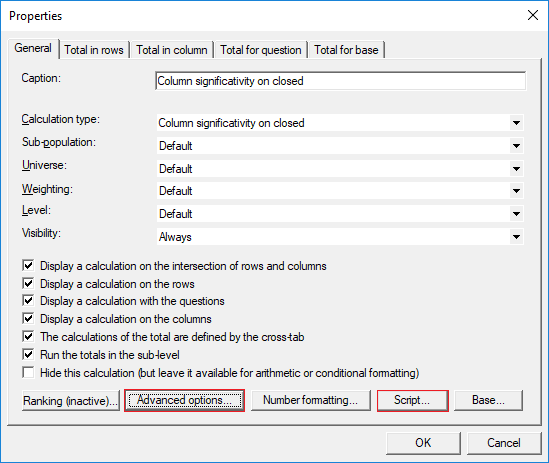
- Options to customise Col-sig lettering and presentation
- Mark numeric values as DK / NA
- Sort and edit data in Analyse (data viewer)
- Make question total “All selected responses”
- Remember last script window size
- Paste text and script into ‘closed by scripts’ calculated question
- Dealing with not asked when a level is not visible for an interview
5.4.9
- Develop questions at run-time
- Create a sub-population for each (selected) response
- Possibility to delete a selection of sub-populations
- Question suppression on "unbroken" tables
- Create login system for open AskiaField task (Open live survey)
- Remove html tag in any caption
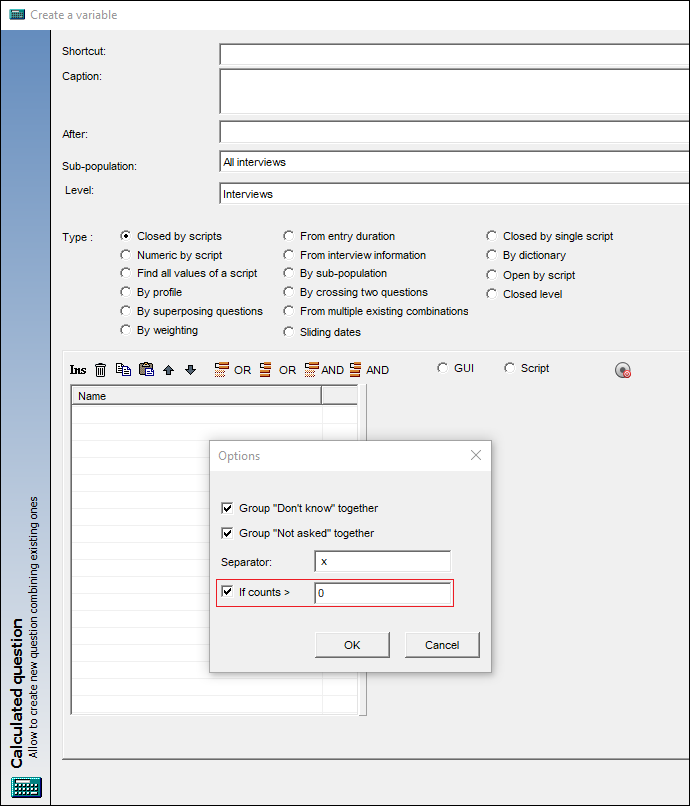
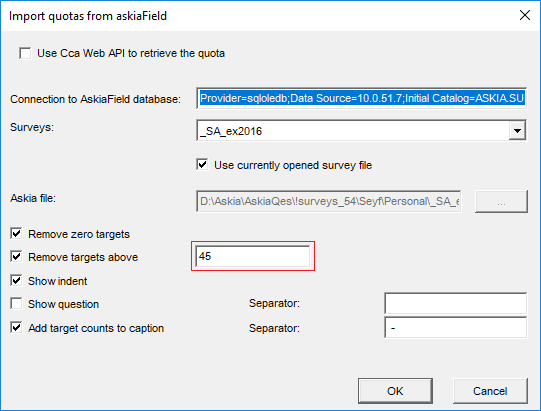
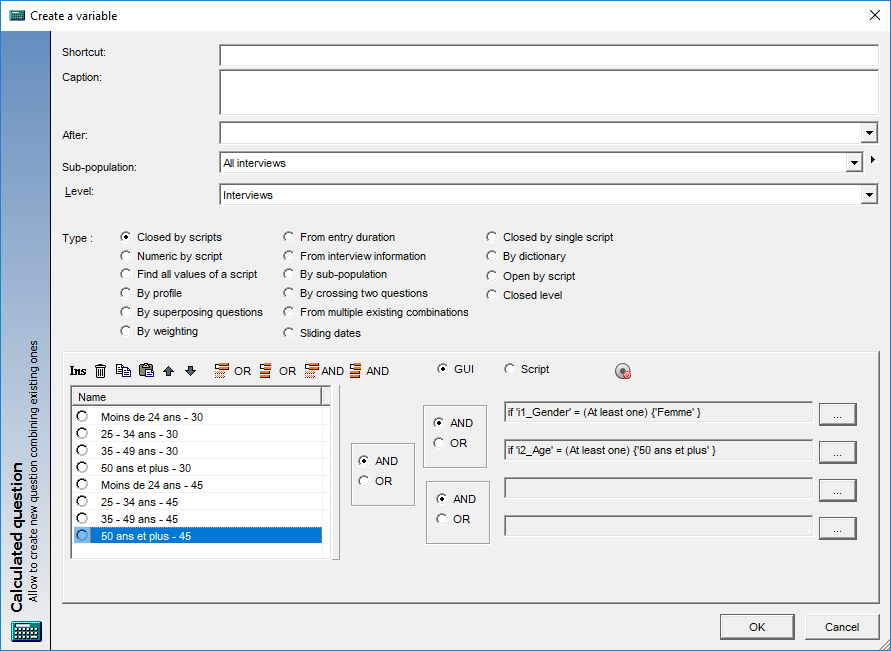
- Closed by scripts calc var: option to remove zero counts
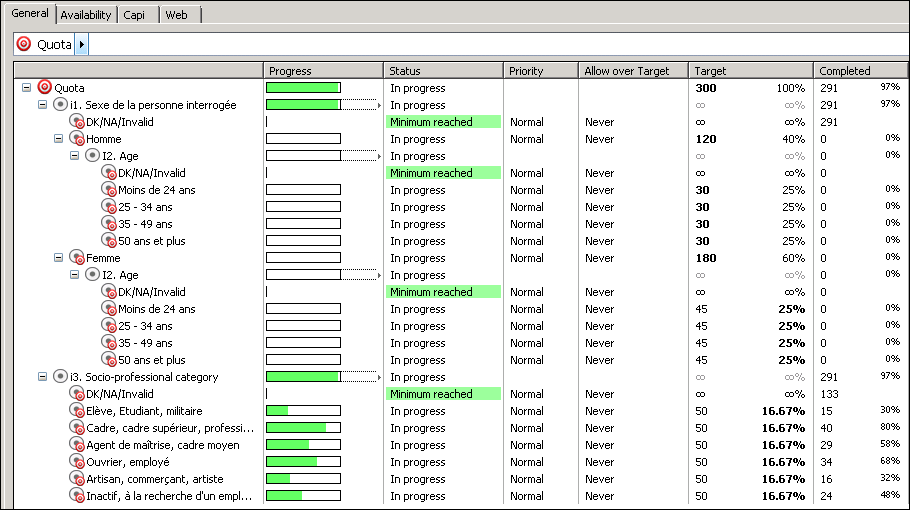
- Quota variable: exclude targets above n
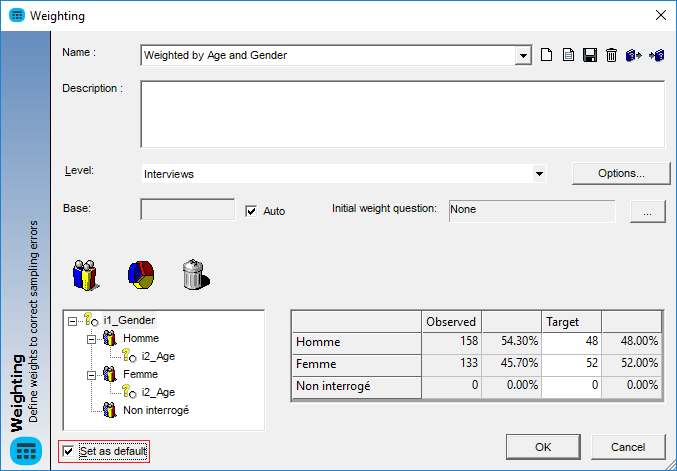
- Weightings saved as default in the QES file
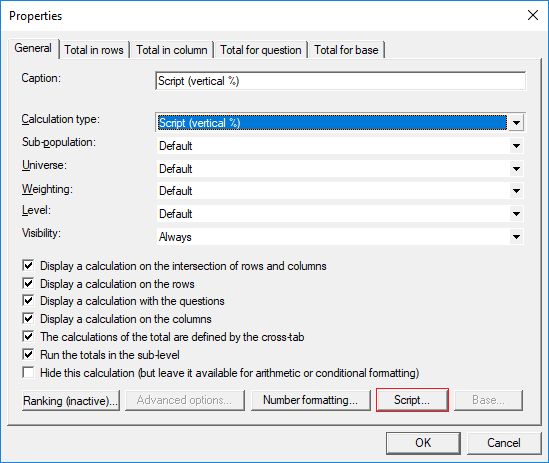
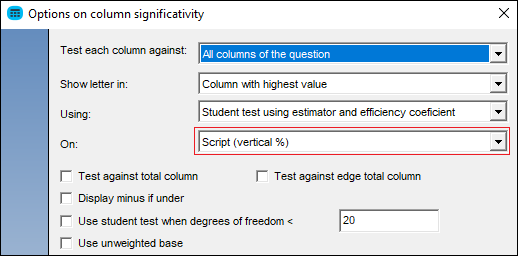
- Col Sig On Vertical % by script
- Serialised version of QEW files and XML Files for analyse objects
5.4.5
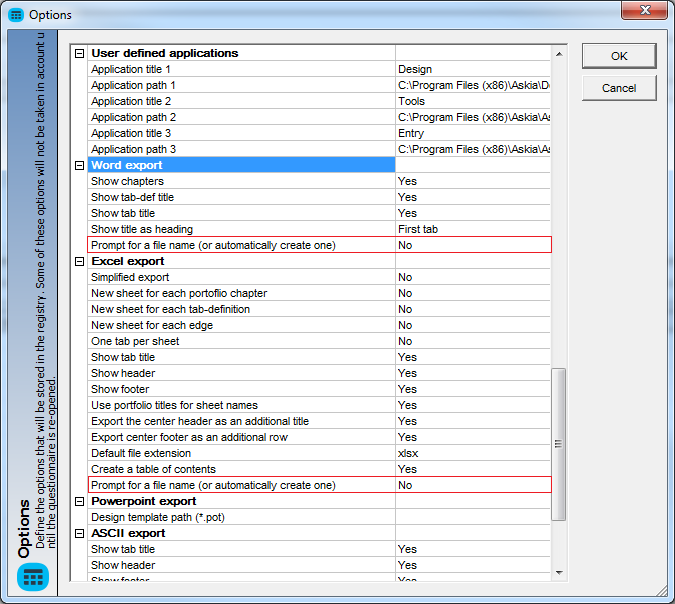
- No prompt to save an Excel or Word export. With the options shown below you can instruct Analyse to automatically save your Excel and Word exports in the .dat directory which sits in the same location as your .qes or .qew.
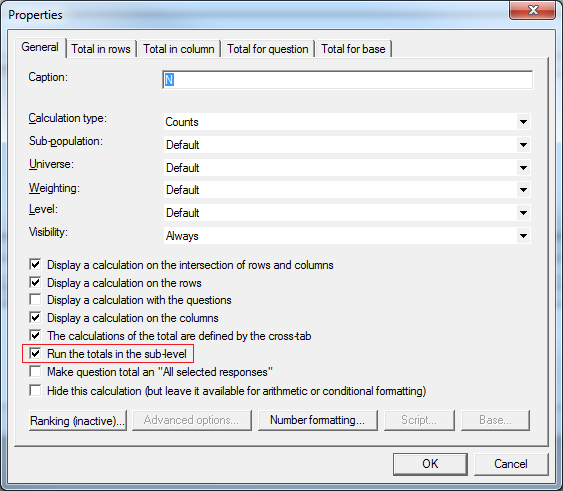
- Run totals in the sub-level. This is a new option on calculations to give more flexibility in achieving the required results for looped data.
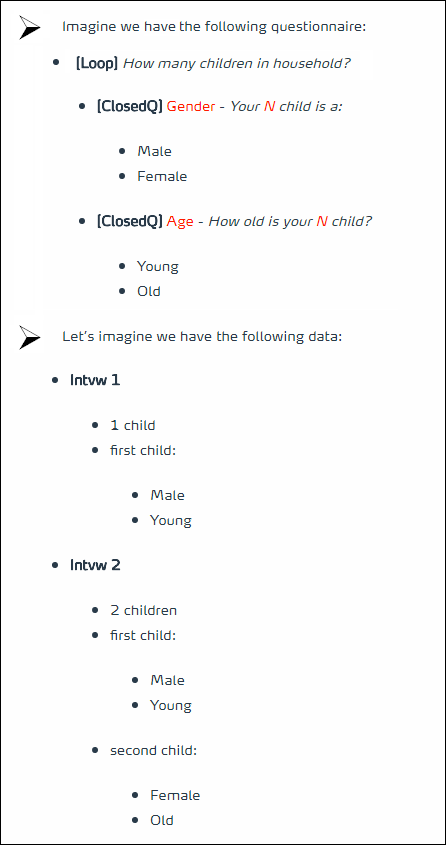
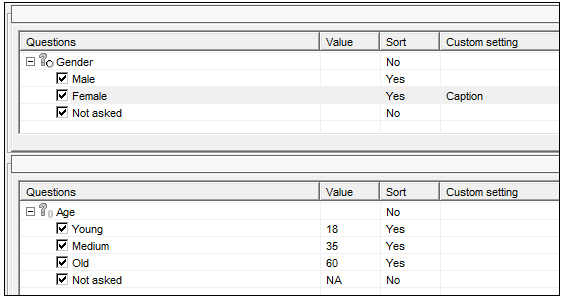
Now let’s imagine we cross Gender x Age in the Interview level. In other words, the total row and total column will not indicate the number of Children but the number of Households.
The data we will get is the following:
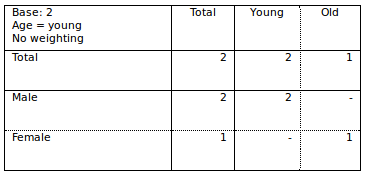
If we remove the Age: Old column by deselecting the response (but run with Universe = selected response), we get this table:
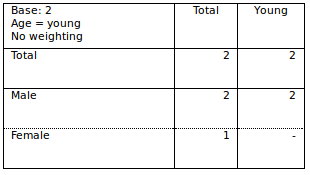
One might question the 1 for Total Female, but the reason behind this is that the second household is selected, and they have a female child.. hence the 1.
Now, using the new run totals in sub-level option, we can produce the following table:
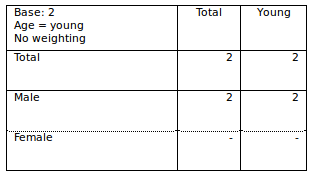
What we are doing here is that the flat counts are using the Universe of the cross-tab to produce the result. In other words: the flat counts are made in the Children level and brought back, Household per Household, into the right Level.
This option (shown below) is arguably more intuitive and is set by default on calculations from 5.4.5.0
5.4.6
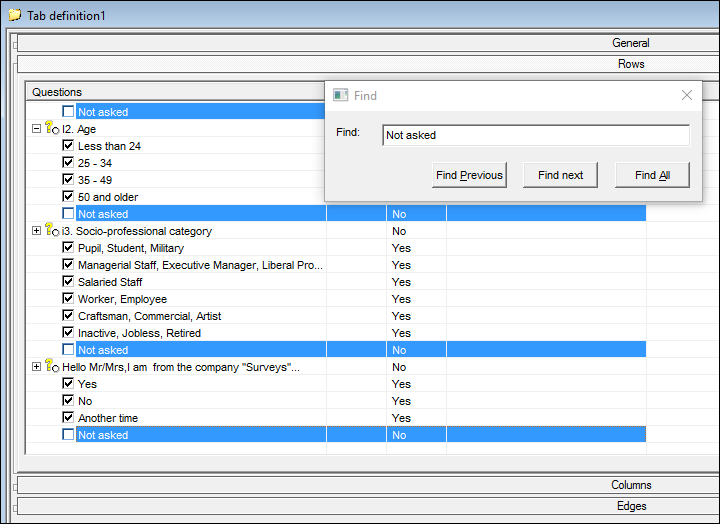
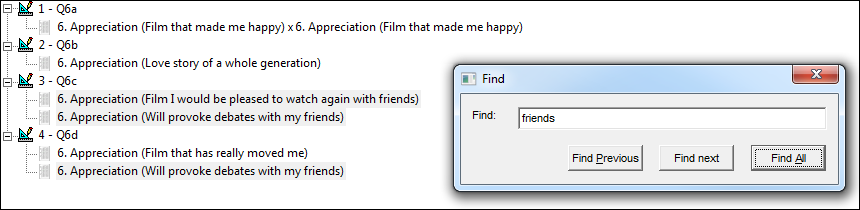
- Find option in portfolio and tab definition. There are a number of options to search for text in the questionnaire tree but no so many for the same in your portfolios and tab definitions. We have added a Find function in these elements. Simply press Ctrl+F (or righ-click > Find) in the rows, columns or edges to search. It highlights all responses or variables with the string you search for in the active section.
It’s the same in the portfolio view:
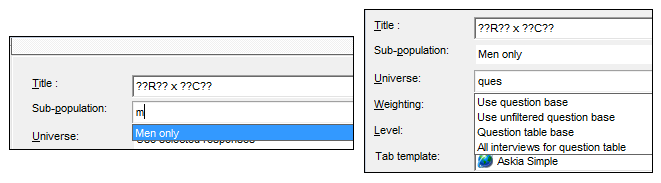
- The search functionality extends to the universe and sub-population dropdown boxes in the General tab. Simply type in and it returns a list of elements matching the entered string
- New keywords. There are some new keywords added. Users have asked to return the profile names so they can display the name of a break, for instance, rather than just a single variable name.
- ??CPN?? - name of profile found in the column
- ??RPN?? - name of profile found in the row
- ??EPN?? - name of profile found in the edge
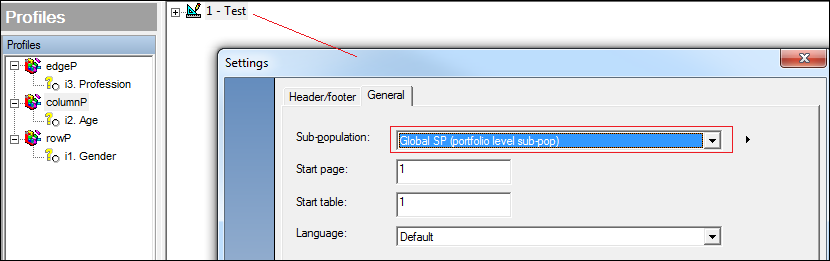
- ??GSP?? (global sub-pop) - return the name of the sub-pop applied at the portfolio level e.g. Global SP (portfolio level sub-pop)
- ??GSPD?? (global sub-pop description) - return the description of the sub-pop applied at the portfolio level
- ??Version?? - to return the version of Analyse used and the whether it’s the 32 or 64 bit application being used e.g. 5.4.6.0 [32 bit]
- Do not suppress option. You now have the ability to exclude whole questions or individual responses from suppression by unticking the options shown below in the element properties:

- Add external data to portfolio. You can now read your own Excel or csv data in askia portfolios:
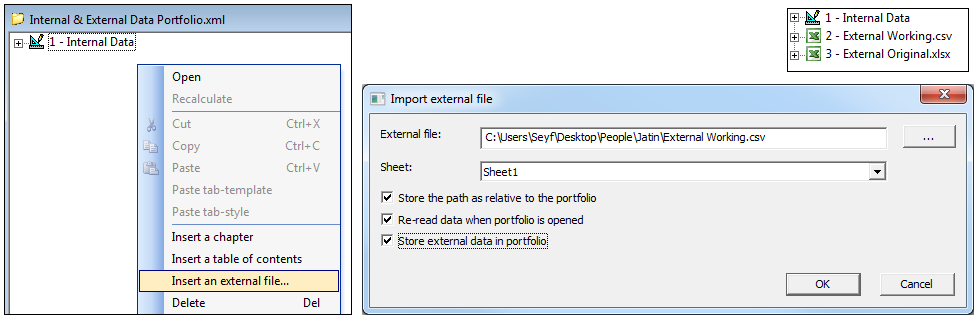
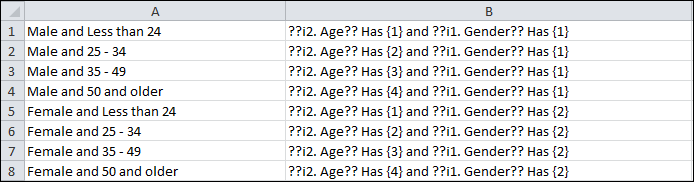
These tabs will be available through the calculation arithmetic or cleaning scripts like this:
GetTable("External Working.csv",1).GetCell(3,5) for instance.
The data can be re-read when you open the portfolio (and also stored in the portfolio if you want to share it with someone without sharing the excel file). When storing the data in the portfolio, tabsMLS is used internally.
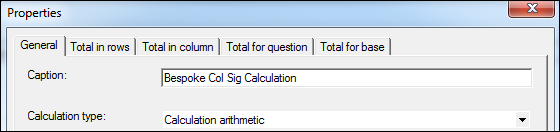
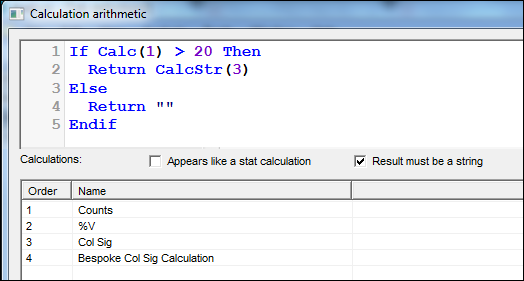
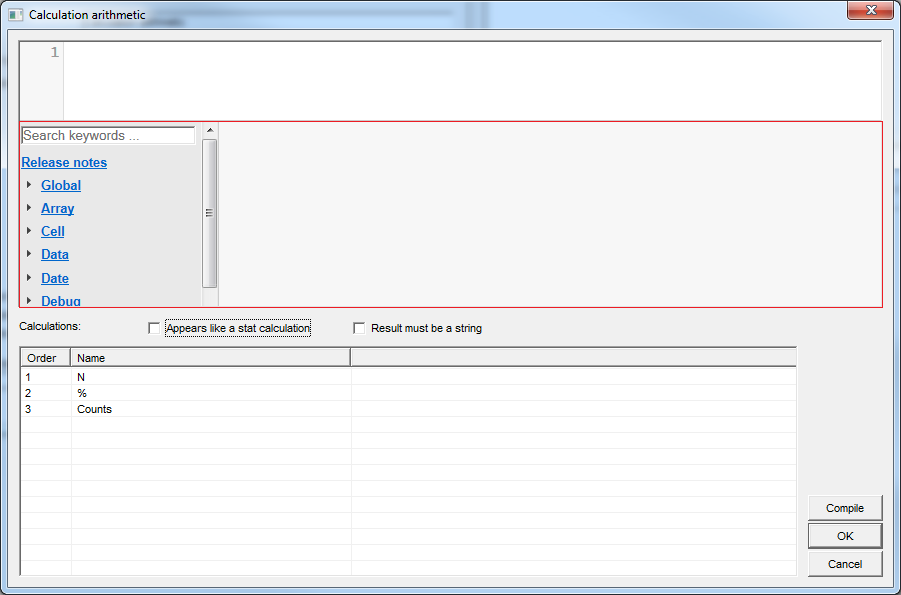
- Calculation arithmetic to pass string calcs using CalcStr(n). This opens up more flexibility in dealing with string calcs. It can prove quite useful when trying to make small, bespoke tweaks to the way your sig tests are returned, for instance.
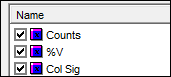
e.g. If I want my col sig output (CalcStr(3)) to only be returned for counts (Calc(1)) over 20 then I could write the following into a new calculation arithmetic calc:
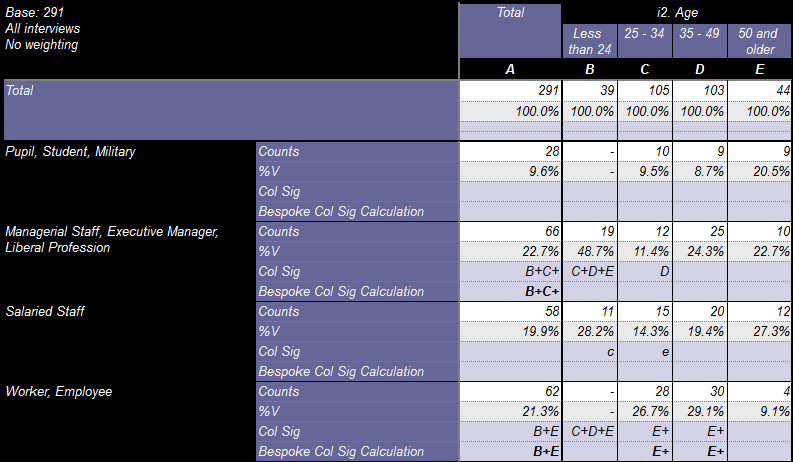
The result for comparison purposes:
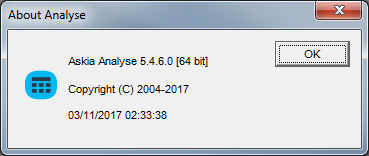
- Version and file location. Sometimes users have difficulty knowing whether they are in the 32 or 64 bit Analyse application and even where the location of the .qes or .qew file is. We have added two small features to remove the hassle:
Click on the blue question mark in the top tool bar to bring up the Analyse version info and you will see it now shows the bit version as well.
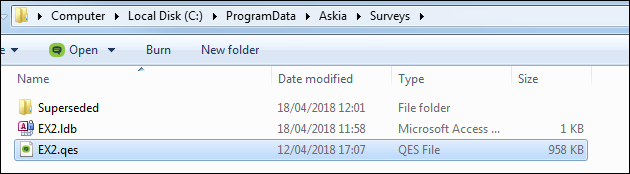
To find the location of your file, double click on the name of the data file in the bottom right hand corner of Analyse next to the interview count:

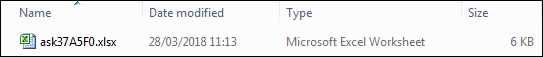
It opens Windows explorer in a new window and highlights your data file:
You can now run weightings in mixed levels –
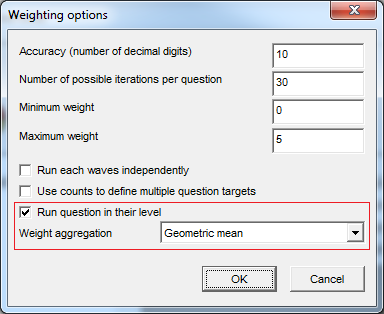
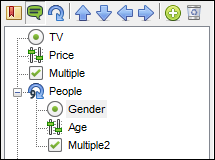
Imagine you have a section in your survey as follows:
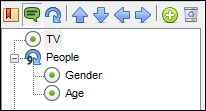
“Do you have a TV in your household?” - followed by taking the Gender and Age details of each member of the household
Previously, if the weighting was run on the interview level, Gender and Age would be moved up to the interview level (changed to a multiple) and weighted there. This meant you couldn’t always achieve the results required across levels but now we have the functionality to weight variables in their own level to give more flexibility.
E.g - Imagine the weighting (weightOnOrgVar) as follows:
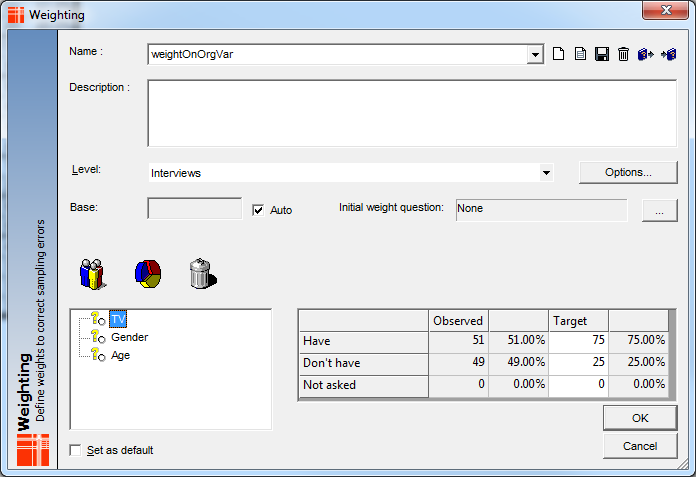
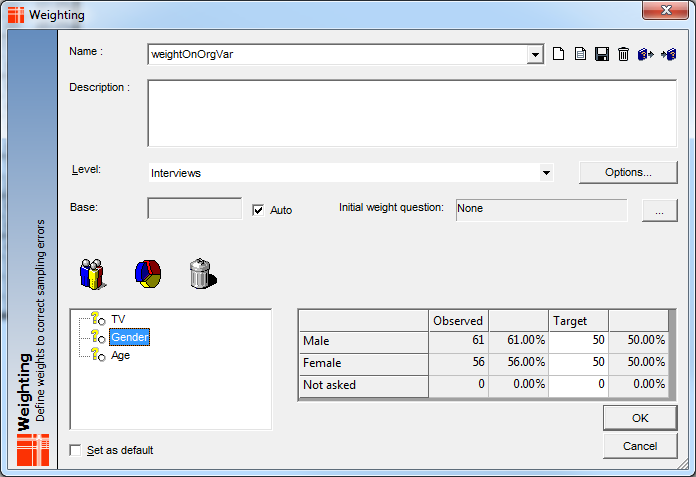
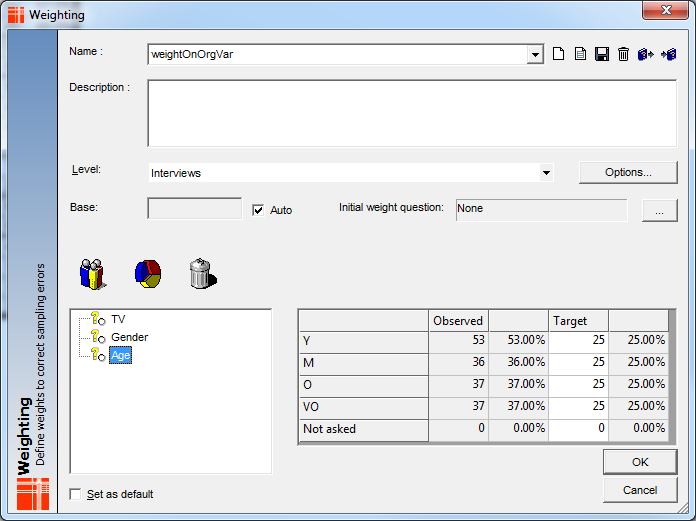
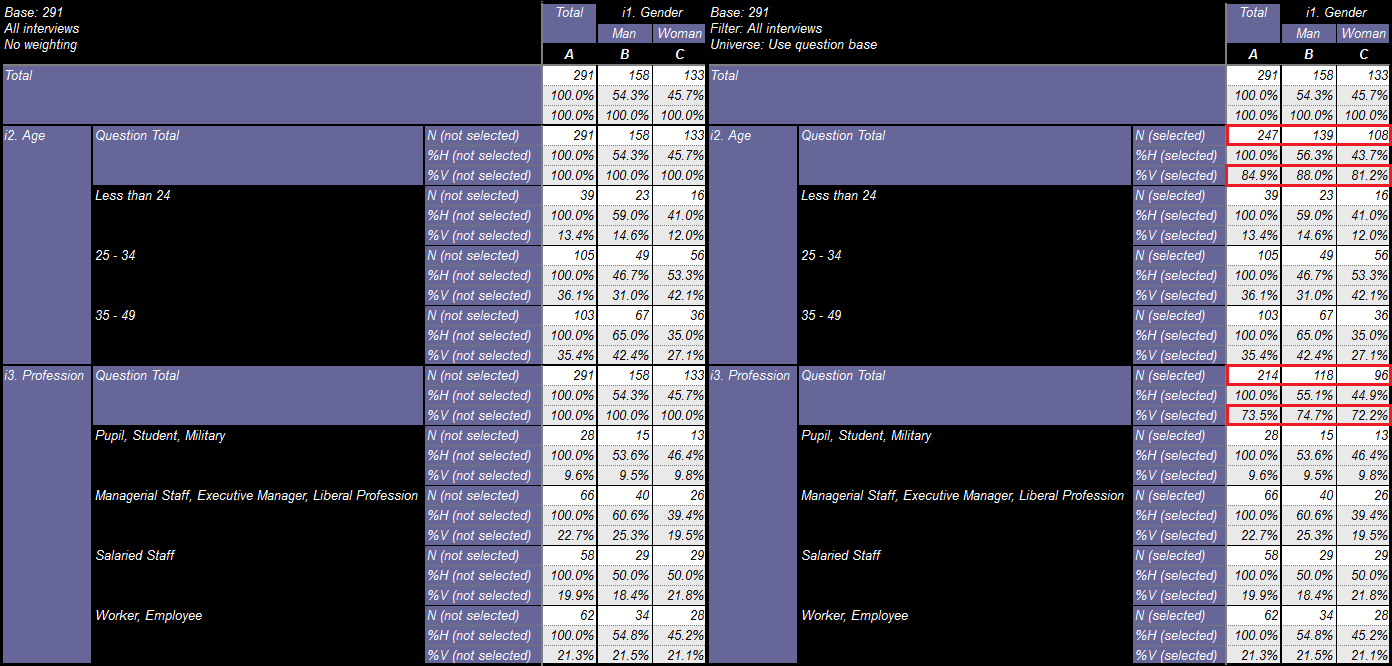
In 5.3.5.5, the table below wouldn't have provided the correct target weights across the mixed levels (see figures boxed in red):
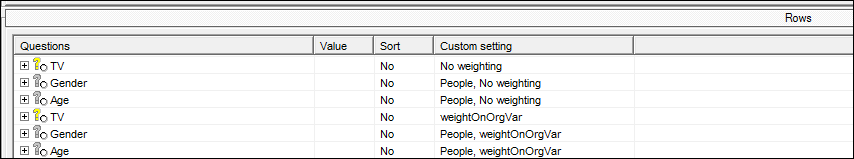
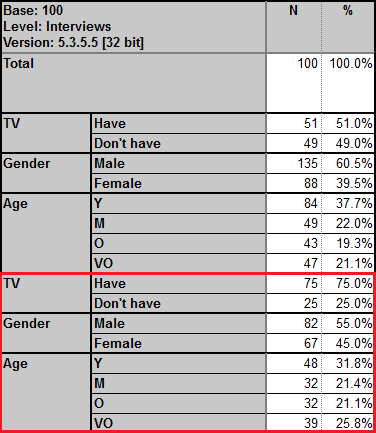
but in 5.4.X you have the ability to weight across the mixed levels (see figures boxed in green):
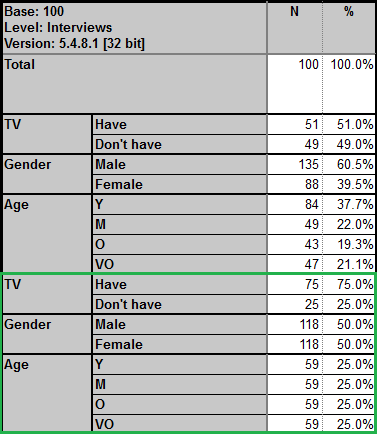
* Please note; whilst this feature was introduced in Analyse 5.4.6.0, we advise you use 5.4.8.1 onward as the functionality/algorithm has been improved recently.
5.4.8
- Options to customise Col-sig lettering and presentation. Users sometimes want to change the col sig lettering to match the initials of brands or segments in their break, for example.
- A: You can specify which letters are used for the col-sig (instead of A-Z). Simply list the letters - or you can also put strings separated by ';'

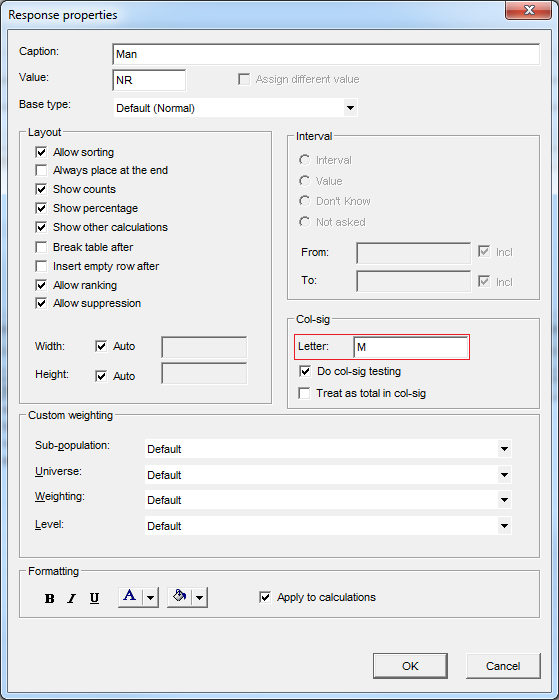
- B: You can associate some letters to columns or edges - right click on the profile and select col-sig naming:
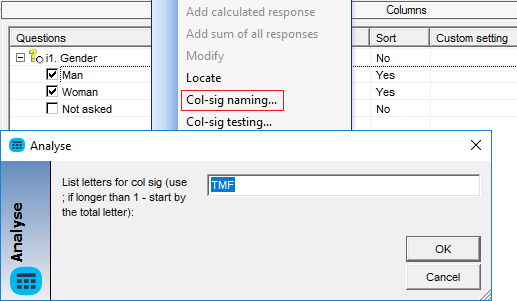
You can either specify the letters like this "T;M;F" or "TMF" (e.g. Total Male Female). The first letter is always for the total. Calling this sets the property of the profile items - and you can also access them by their response properties:
Since you can specify the letters for columns and edges, they are combined for a given edge and a given column (if the edge has the letter Y for Young and the column has the letter M for Male, the corresponding column will have the letters YM).
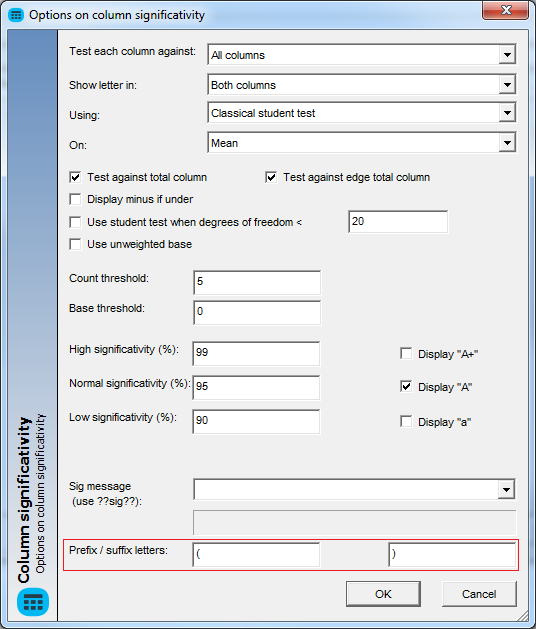
- C: Since it could be confusing to read the letters YMOMYF, you have the possibility of specifying a prefix and suffix to the letters (parenthesis for instance) which will make the result look like this (YM)(OM)(YF). This is available in the advanced options of the col-sig tests:
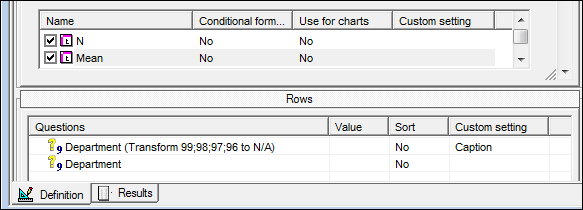
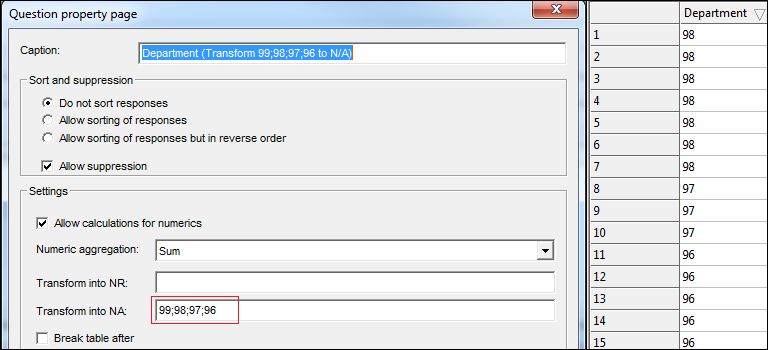
- Mark numeric values as DK / NA. We have added a way to make sure that values (like 99) are understood to be invalid on the fly without having to create a new variable. You can transform them into NR (no response, also known as system Don't Know) or NA (Not asked). Separate all the values you want to filter with “;”.
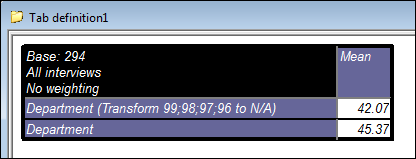
In the example below I have tabulated the same question twice. In the first version I have made all values 96 or higher into a non-response so these values will be removed from the mean calculation:
When you highlight one or more questions in the question tree and go to View menu > Data, you can see the raw data of the selected questions. We have now added the functionality to sort and edit the data
Sort:
- The sort is done on the code numbers (even if you don’t have ‘Show modalities as numbers’ ticked)
- You can only sort one column at a time
- To go back to your original order, click at the top of your first column (shown with red box below)
Edit:
- Edit can be performed only when ‘Show modalities as numbers’ is ticked
- The undo button is not yet operational for data edited in the data viewer
- If you need to see the log of changes (before and after) it's in the .dat folder: ManualModifications.xml
- You cannot edit any type of calculated questions
- You cannot edit any non-looped question if the level is not set to ‘Interviews’
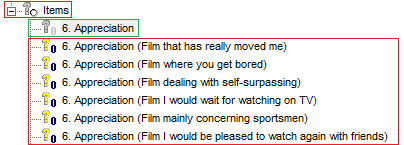
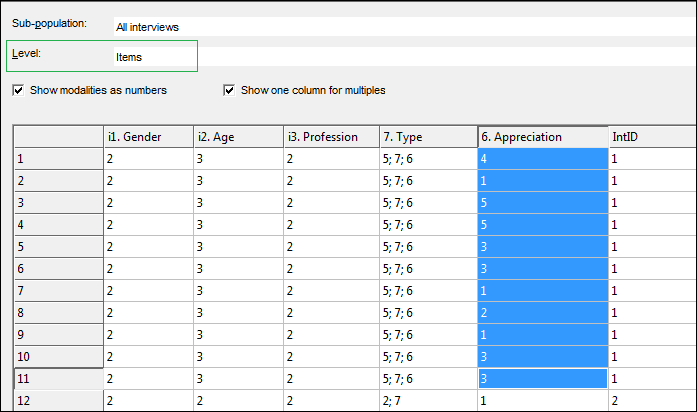
- You cannot edit the data of the parent loop variable or developed questions but you can edit the aggregated, sub questions of the loop (shown in green below)
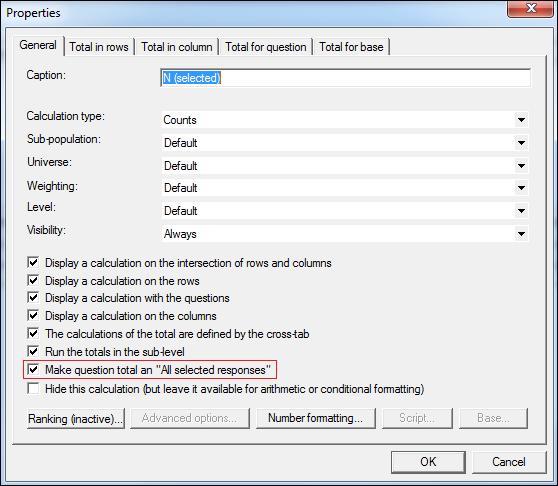
We have implemented a way to transform the question total as something like a group of all selected responses. It's an option that we have added to the calculation so you can decide which way you work. This would only affect tabs where you are not using "Selected responses" as universe and not the ones where you select all the responses which are given.
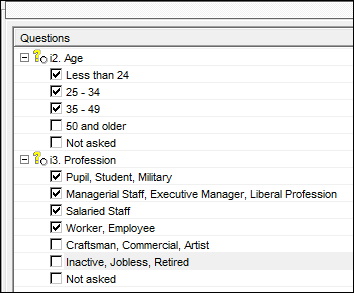
In the example below we have the selection as shown and ‘Use question base’ as the universe:
The difference can be seen below between the table on the left where the option is selected and the table on the right where the new option is not selected.
Note that the counts are affected (the Gender break down is not done on Question Base anymore but adjusted to reflect the selected responses in the rows).
- Remember last script window size. Since Intellisense was introduced some of the script areas have been reduced. We now save your last script window size used so you don’t have to expand them manually each time. In addition, the Intellisense keyword search panel will soon be minimised by default to give more space and can be expanded when needed by pressing the ‘+’ button:
- Paste text and script into ‘closed by scripts’ calculated question. Now you can set up both your captions and conditions in Excel to transfer by copy & paste to this variable type in Analyse. Start with something like this in Excel:
Copy and then hit the clipboard icon in the variable creation to paste:
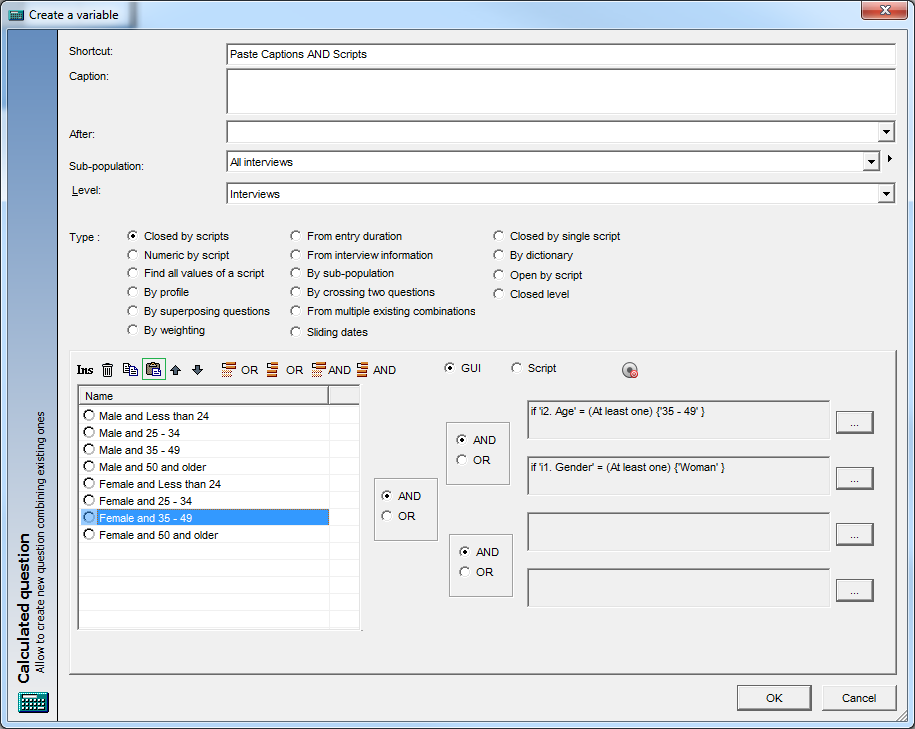
The functionality doesn’t accept comments or line breaks in scripts to be pasted at the moment.
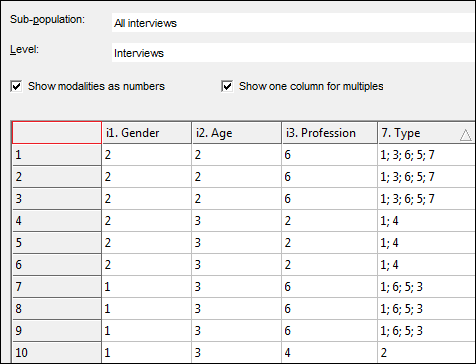
- Dealing with not asked when a level is not visible for an interview. Not asked in levels - When no data in sub level it did not appear as not asked in the parent level.
e.g. let’s assume we have 10 interviews in as small survey as follows:
Interviews 4, 6, 7 & 8 have not answered the loop
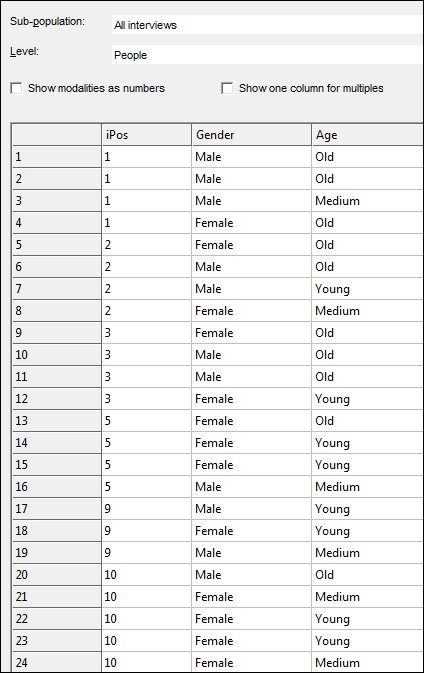
When we view on the loop level (only people who entered the loop) there are no ‘Not asked’ as expected.
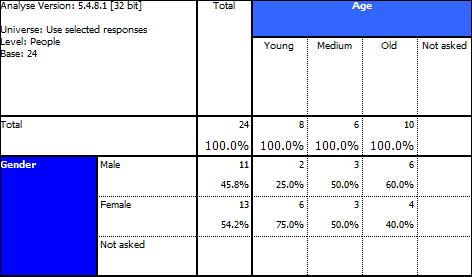
However, note the difference before and after version 5.4.8.1 when we run the results on the interview level:
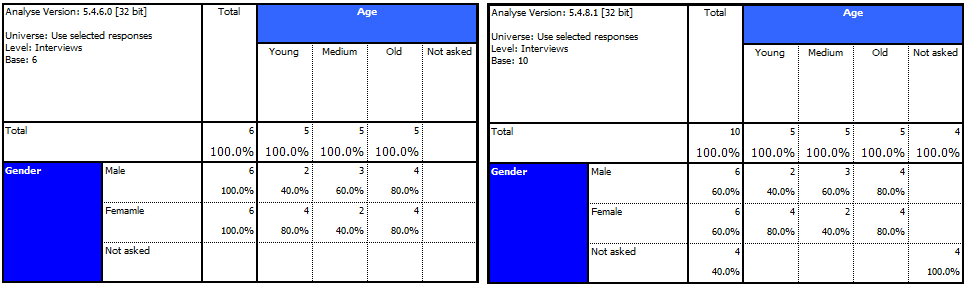
We now correctly see interviews 4, 6, 7 & 8 as part of the ‘All interviews’ or ‘Use selected responses’ base when not asked are selected.
5.4.9
- Develop questions at run-time. Previously, if you wanted to display all the developed questions of a loop in your tables you would have to place all the developed questions in the tab definition.
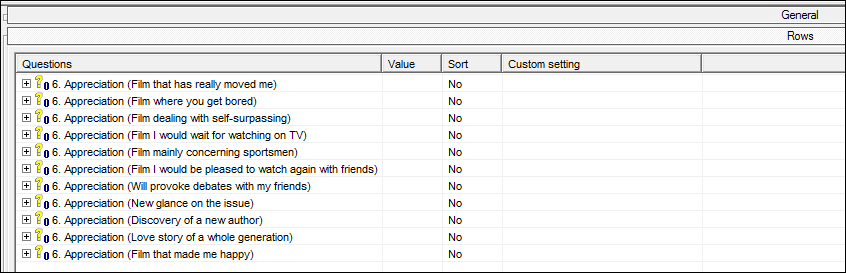
The problem with this is if you add new iterations to your loop (therefore creating new developed questions), you would have to ensure you manually added these to the tab definition next time you came to run it. Now you can drag the grey, loop question in to the tab definition and tick the option 'Develop questions at run-time' and it will automatically develop all available questions for the loop. No more manual updating!
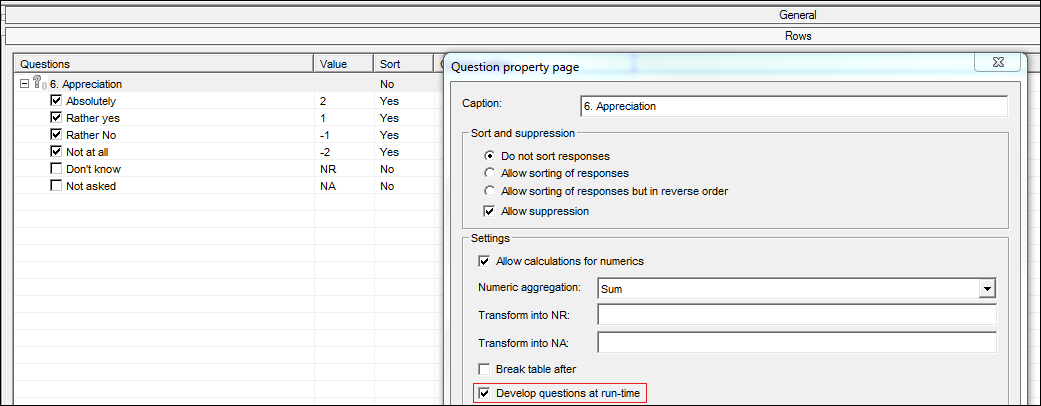
The added benefit is that any formatting applied to this variable is automatically replicated across all developed questions. No more need to copy and paste presentation from the first variable to the others.
- Create a sub-population for each (selected) response. When you right click on a variable in the question tree, there is an option to create a sub-population for each response. Until now, users didn't have to option to freely select responses of the question to create sub-populations from which could lead to unnecessary clutter and work to remove them. Now you can highlight responses in the response distribution window below the question tree and right click on selected responses to create sub-populations this way.
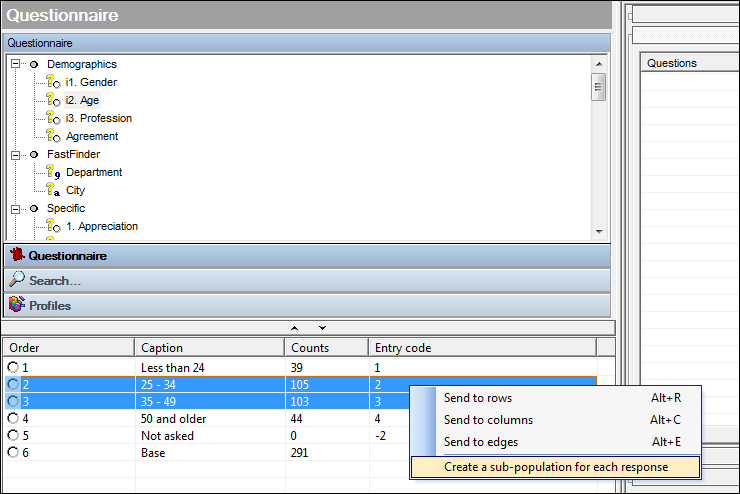
You will also notice some menu options to send only the selected responses to rows/columns/edges. This will send the variable to the tab definition with only the highlighted codes selected.
- Possibility to delete a selection of sub-populations. The sub-population list can get cluttered over time and users only ever had the option to delete sub-populations one by one. Now we can click on the red trash can icon in the sub-population menu which brings up a multi-select menu of elements to delete:
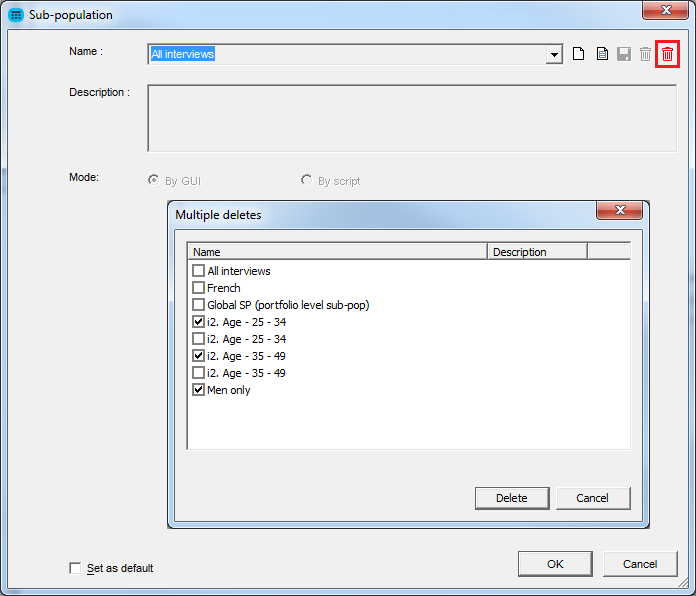
The drop-down list will refresh once you've closed the menu down and gone back into it.
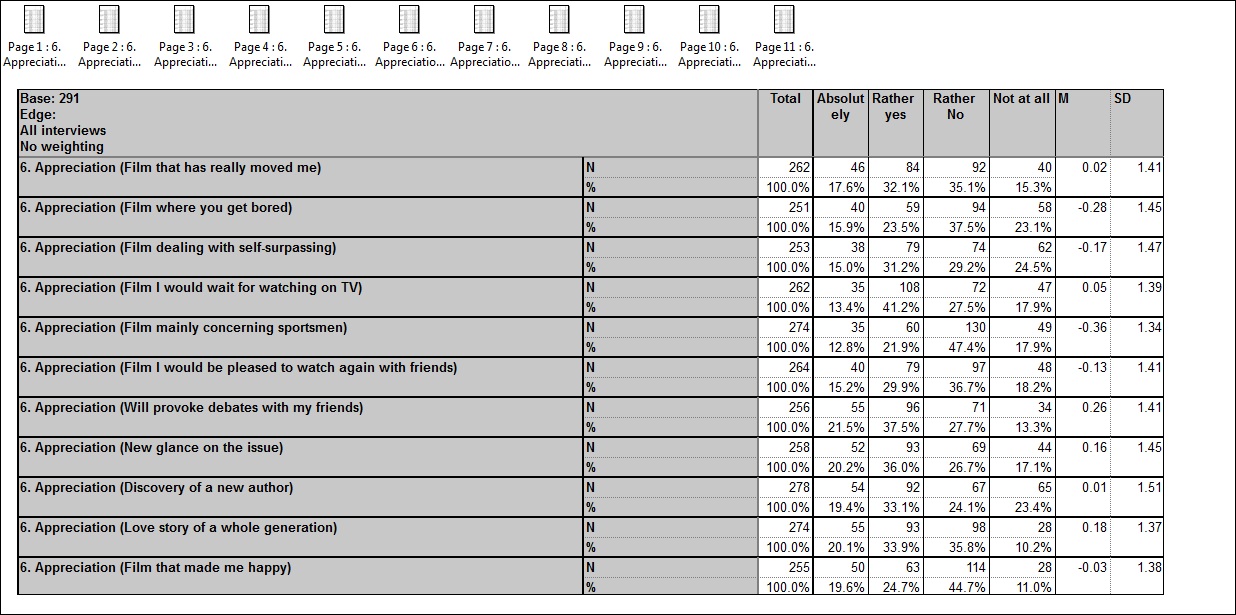
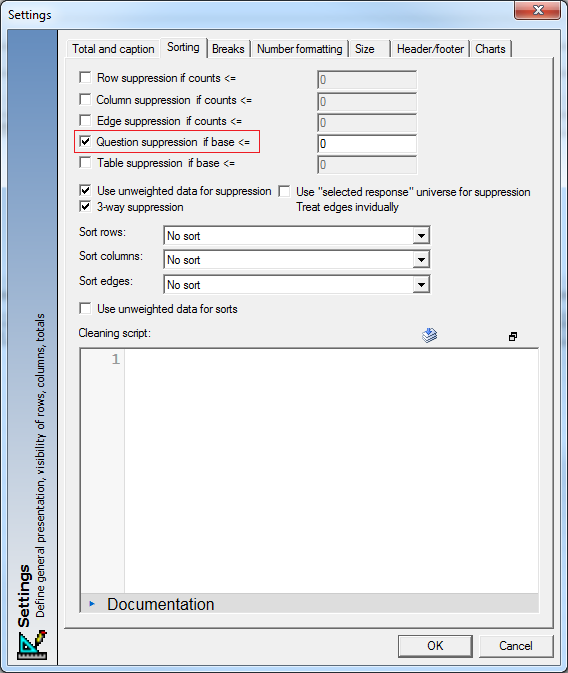
- Question suppression on "unbroken" tables. There was previously no option for table suppression if your tables were all in one page. Now you can suppress in this way using the option shown below:
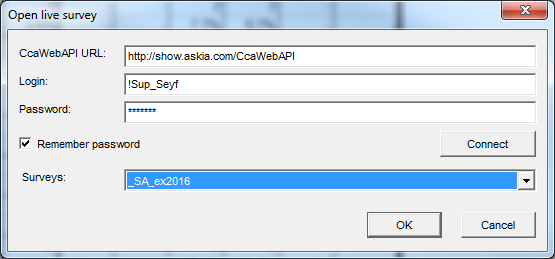
- Create login system for open AskiaField task (Open live survey). In order to make access to live field task data GDPR compliant, we have implemented a login system which is used through the File menu > Open live survey.
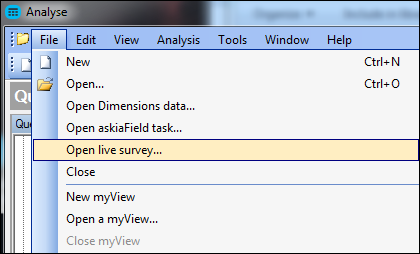
To use it:
You need the CCAAPI and CCAWebAPI installed:
https://support.askia.com/hc/en-us/articles/115005091989-Install-askiafield-REST-API
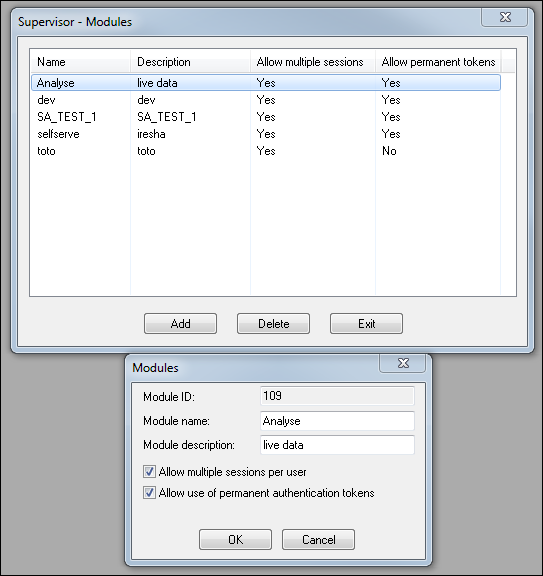
Ensure a module is set-up in Supervisor > Extra > Modules:
Ensure each user's restriction which needs this access has the module selected in Restrictions > Properties > Modules > Management:
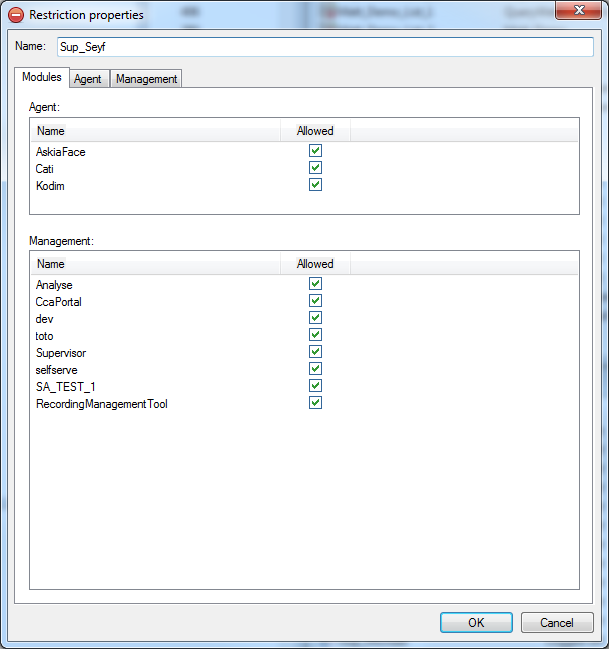
The restriction will also need:
- allow direct access to survey/list data
- 'view' permissions on the survey
- 'view interview data' permission on the survey

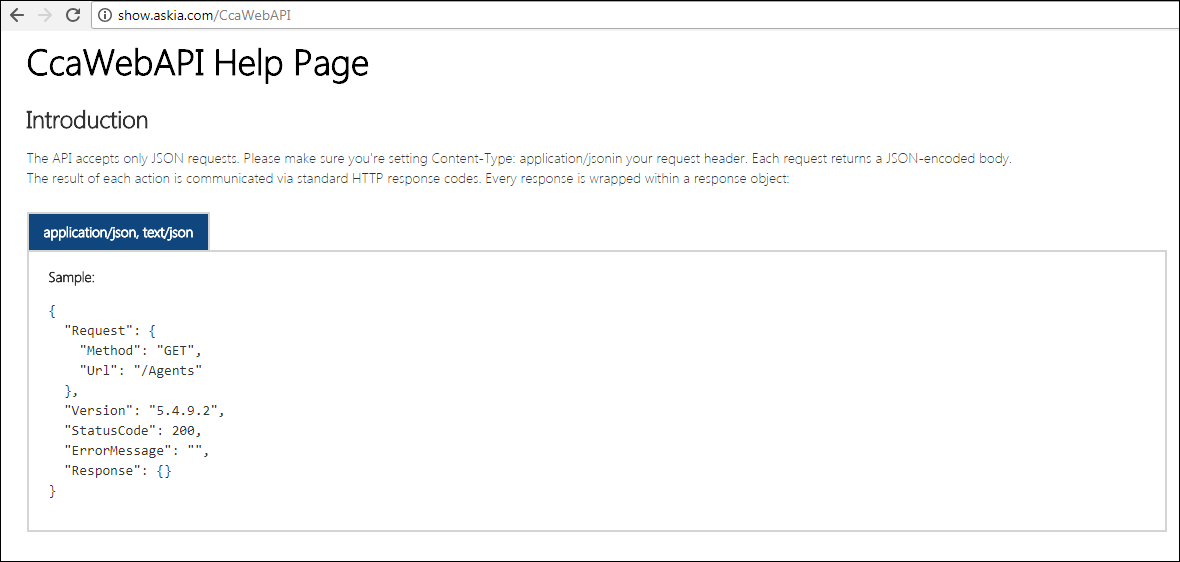
Review the CCA settings to figure out how to set up your link to use for CCAWebAPI if you don't already know it. An example below of the sort of adapting needed.
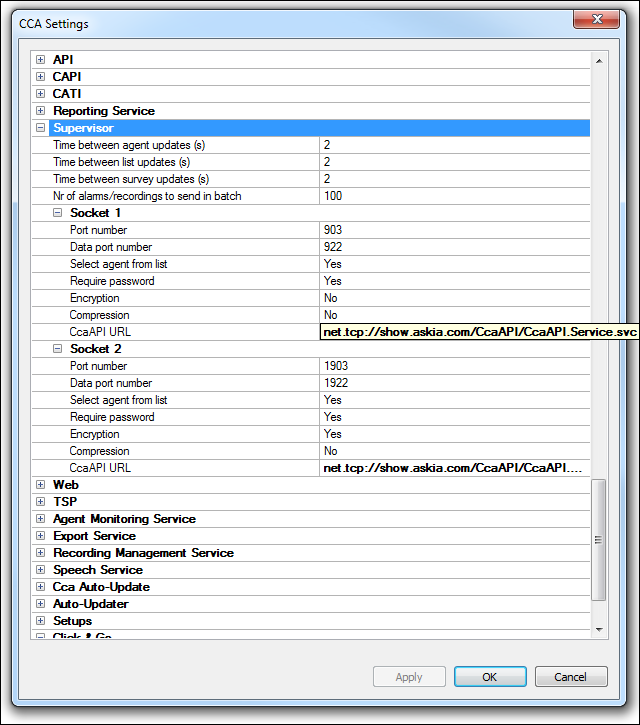
Now log in with the agent credentials which is using the updated restrictions. Select your survey from the drop-down box. After clicking OK you will see the Analyse session as normal accessing the current field task data.
The correct link should open up a help page as follows:
This feature ensures Askia Analyse is GDPR ready because it reads encrypted SQL data on-the-fly as well as having a secure and encrypted connection to the database.
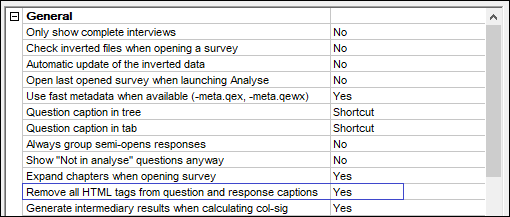
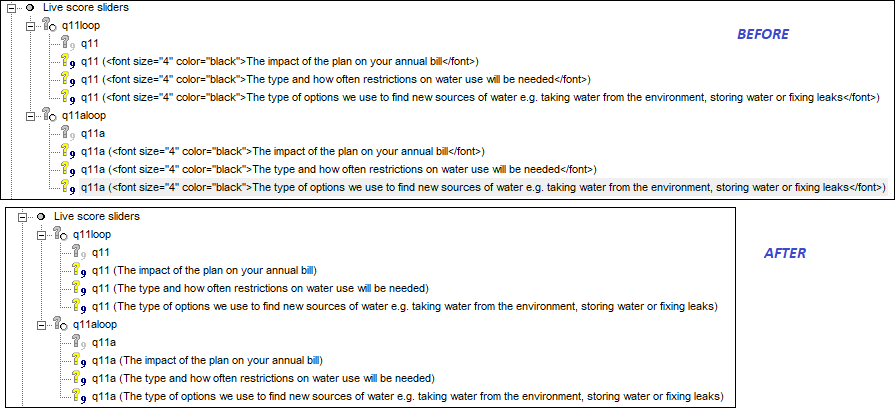
There is a new setting in the AskiaAnalyse options to remove html tags from short, long and response captions.
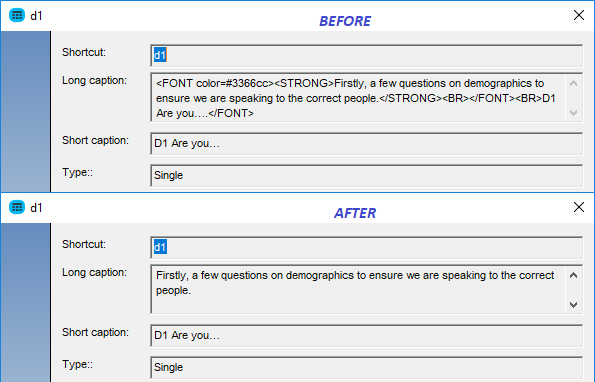
Examples before / after shown below:
Ex.1 - Long caption:
Ex.2 - Response caption:
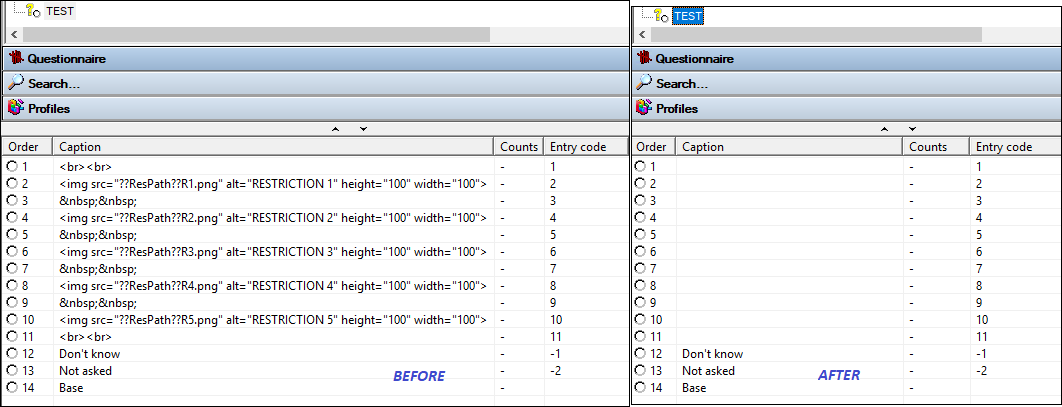
Ex.3 - Response caption of a loop variable:
N.B. If the response captions of a loop have html tags then the shortcut of the developed question will be amended accordingly. Be careful if you are doing this as you are changing a question shortcut and it can have an impact e.g. in portfolios or scripts which reference these shortcuts.
These files are called:
- InfoCalcVars.xml
- InfoCodings.xml
- InfoWeightings.xml
- InfoProfiles.xml
- InfSubPopulations.xml
- InfoTabTemplates.xml
- InfoDefaults.xml
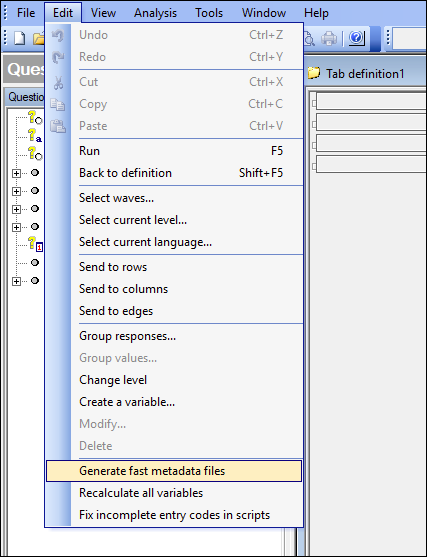
Doing this for multiple projects in one go is not a problems as you can generate all the fast metadata and XML files from the command line:
Analyse.exe "C:\My qes\LatestVersion.qew" /fastmetadata
This is an improvement of the functionality we had before where Fast Metadata (FMD) files could only be produced for the .qes files within a Surf set-up and not the .qew nor a stand alone .qes file as we have since 5.4.9.1.
This complete removal of the reliance on ADO drivers in the data files means a significant improvement in speed of data processing in Analyse or Vista.
In order to use this functionality in Vista, you must have the option to 'Use inverted data when available' ticked and ensure the survey is inverted. The -meta.qewx, -meta.qex, .qew-meta.dat (or new .dat) including the XML files must all be uploaded to the vista directory along with the files you would normally have there.
There is a document here which details the steps to use when making updates to a continuous data-set using FMD files.