Weighting efficiency
Weighting efficiency provides the amount of distortion needed to arrive at the weighted figures - i.e. how much the data is manipulated by the weighting.
The result is stored in the weighting report located in the survey.dat directory.
A low efficiency indicates a larger bias introduced by the weights.
Here is the formula that is used to calculate it:
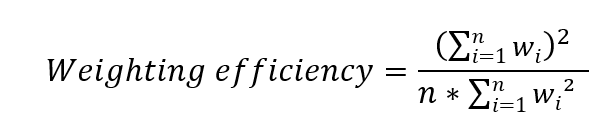
For example:
| w i | w i² | |
| i1 | 0.820508273 | 0.67323383 |
| i2 | 1.027660121 | 1.05608532 |
| i3 | 0.798126889 | 0.63700653 |
| i4 | 1.813092082 | 3.2873029 |
| i5 | 0.524670726 | 0.27527937 |
| i6 | 1.682138128 | 2.82958868 |
| i7 | 0.066485204 | 0.00442028 |
| i8 | 1.524746555 | 2.32485206 |
| i9 | 0.571220139 | 0.32629245 |
| i10 | 1.878748796 | 3.52969704 |
| i11 | 0.070238083 | 0.00493339 |
| i12 | 1.840453697 | 3.38726981 |
| i13 | 0.683791839 | 0.46757128 |
| i14 | 1.00838961 | 1.01684961 |
| i15 | 0.833383964 | 0.69452883 |
| i16 | 1.330310173 | 1.76972516 |
| i17 | 0.602917671 | 0.36350972 |
| i18 | 1.257201562 | 1.58055577 |
| i19 | 0.632265608 | 0.3997598 |
| i20 | 1.451447184 | 2.10669893 |
| i21 | 0.622107103 | 0.38701725 |
| i22 | 1.252551275 | 1.5688847 |
| i23 | 0.966905785 | 0.9349068 |
| i24 | 1.561603913 | 2.43860678 |
| Sum | 24.82096438 | 32.0645763 |
| sum(wi) | sum(wi²) |
| n | 24 |
| sum(wi) | 24.82096438 |
| sum(wi)² | 616.0802728 |
| sum(wi²) | 32.06457627 |
| WE | = 616.080273 / (24 * 32.0645763) |
| WE |
80.06 % The weighting reduces the reliability of the sample of 19.1% (~ 100 - 80.06 ~) In other words, it's as if we have removed 5 people from our sample of 24 (24 X 80.06 % =19) |
Our sample is matching to 80.06% of the population and the effective base is equal to 19
When the weighting efficiency is below to 80%, this can mean that you have a mismatch between the sample and the population.
And when WE is below 70%, we recommend you to check the weighting design or perhaps even go back to the sample design.