Remove top & bottom n% respondents from a calculation
| Summary | This article provides examples of how to remove top & bottom n% respondents from a calculation. It focuses on the requirement to adjust the mean score for a numeric variable using the tab template. |
| Applies to | AskiaAnalyse |
| Written for | Data Processors and Analysts |
| Keywords | Summary table, Mean, Numeric calculation, Script calculation, Tab template, General tab, Calculations, Scaled values, RowQuestion, RowSubQuestion, ColQuestion, ColSubQuestion, Maximum, Minimum, Range, Percentage of respondents, Top, Bottom, %, Script (mean). |
For data collected in a numeric question, you may notice that there are outliers which skew your mean score. It's a good idea to use the median instead to reduce this effect. However, sometimes it's necessary to stick to the mean score whilst also lessening the impact of these outliers.
The example QES file and portfolio can be downloaded here. In this case we show how you can remove the top and bottom 3% of respondents from the calculation to return the mean score by applying some script in a Script (mean) calculation.
Our structure:
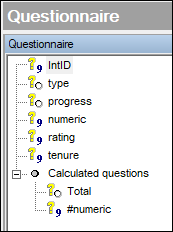
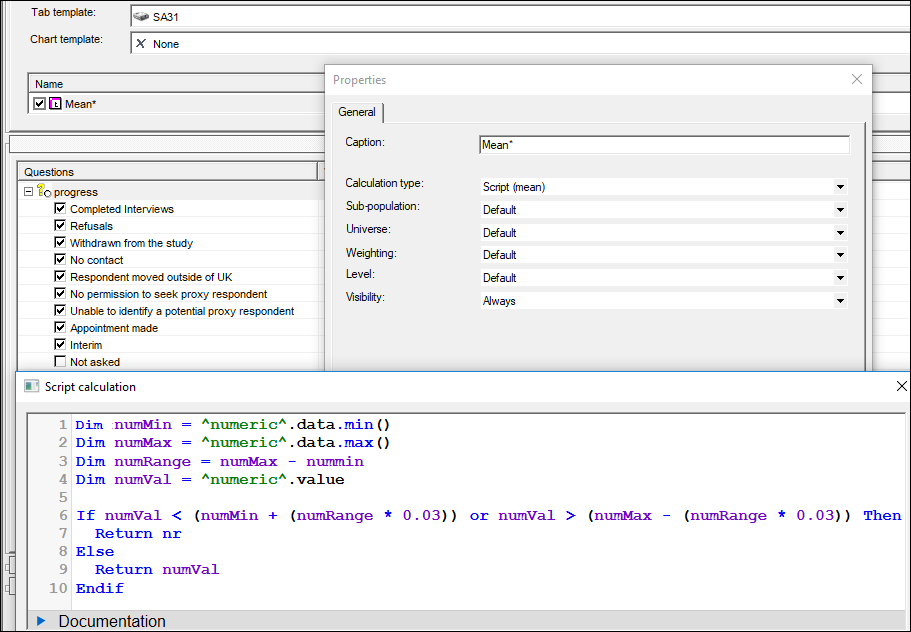
Since we are using a script (mean) calculation, we can refer to any variable in the script which doesn't need to be in our tab definition. To get the adjusted mean scores crossed by the progress variable, we can have this set-up:
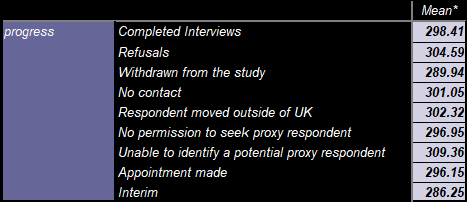
Which produces this result:
Of course, since there is a specific variable reference in the tab template, it can't be reused in its above state to apply this mean score adjustment across several numeric variables.
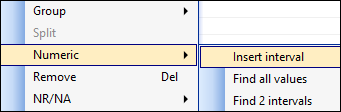
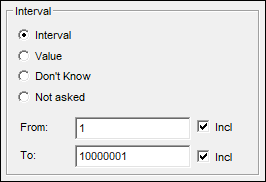
To do this we can replace ^numeric^ in our above script with the keyword RowQuestion. We then amend the tab definition to include the numeric questions in the rows and the progress variable moved to the columns. For the Script (mean) calculation to show, we put at least one response in the numeric question. This can be done by inserting an interval which covers all possible scores:
The set-up (use AskiaAnalyse 5.4.9.0 and above):
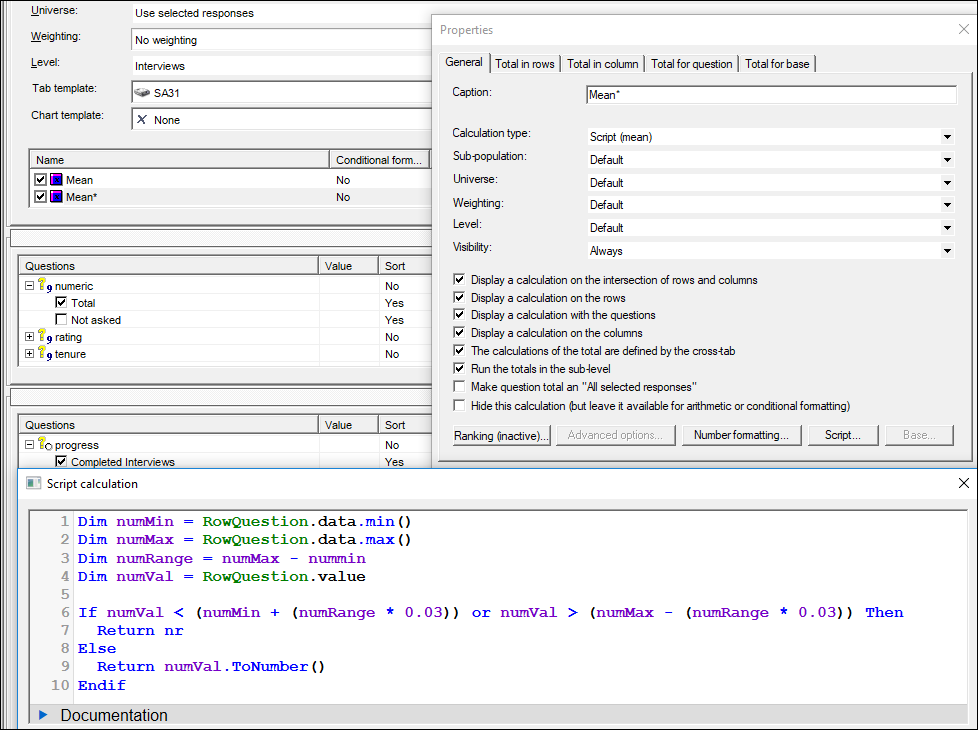
Note how the script removes the top and bottom 3% of answers by working out the min and max values in the variable first, then multiplying this range by 0.03 and removing people who are within this value from the min or max.
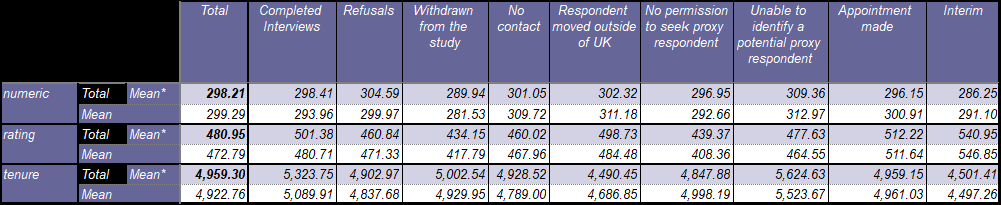
Also note, the adjusted mean is worked out on the whole sample first and then split by your column break. The result is shown below alongside the unadjusted mean scores:
If you want, you can also create a new version of your numeric question which does the same thing using the same script as the first example (see the variable named #numeric at the bottom of the question tree).