Universe Settings
| Summary | This document explains how each of the Universe settings affect the data in your tables in AskiaAnalyse and AskiaVista. |
| Applies to | AskiaAnalyse, AskiaVista |
| Written for | Data Processors, Analysts, Researchers, Statistical Analysts |
| Keywords | Universe, Sub-population, Filter, Count, Base, Percentage, %, All interviews, Use selected responses, Use question base, Use answering base, Allow Don't know, Unfiltered, Question table base, All interviews for question table, Loop, Grid, Summary table, New SQL format, SQL Legacy format. |
To start with, it's important to reiterate the distinction between a filter / sub-population and a Universe.
- Sub-populations - govern the counts appearing in your table
- Universes - do not change the counts but change the percentages in your table
Let's start with the most commonly used Universe settings:
- All interviews - the counts for each code are divided by the total number of interviews.
- Use selected responses - the counts for each code are divided by the total number counts in the responses selected in the question in rows/cols etc.
- Use question base - the counts for each code are divided by the total number of counts in the question (system DK's are included in this count - i.e. people who saw the question, but chose not to answer, e.g. when a question is non-mandatory).
- Use answering base - the counts for each code are divided by the total counts of those giving an answer (system DK's are NOT included in this count i.e. people who saw the question but chose not to answer).
Now on to the unfiltered versions:
Basically these unfiltered universes remove the sub-population (filter) from the total base, before using it in the calculation, to work out the percentages.
Let's look at the example below. On the first row, with just question base universe, the % for Salaried staff is 24/176 = 13.6%. However, when we use the unfiltered base, we divide by 390. So the % for Salaried staff is 24/390 = 6.2%.
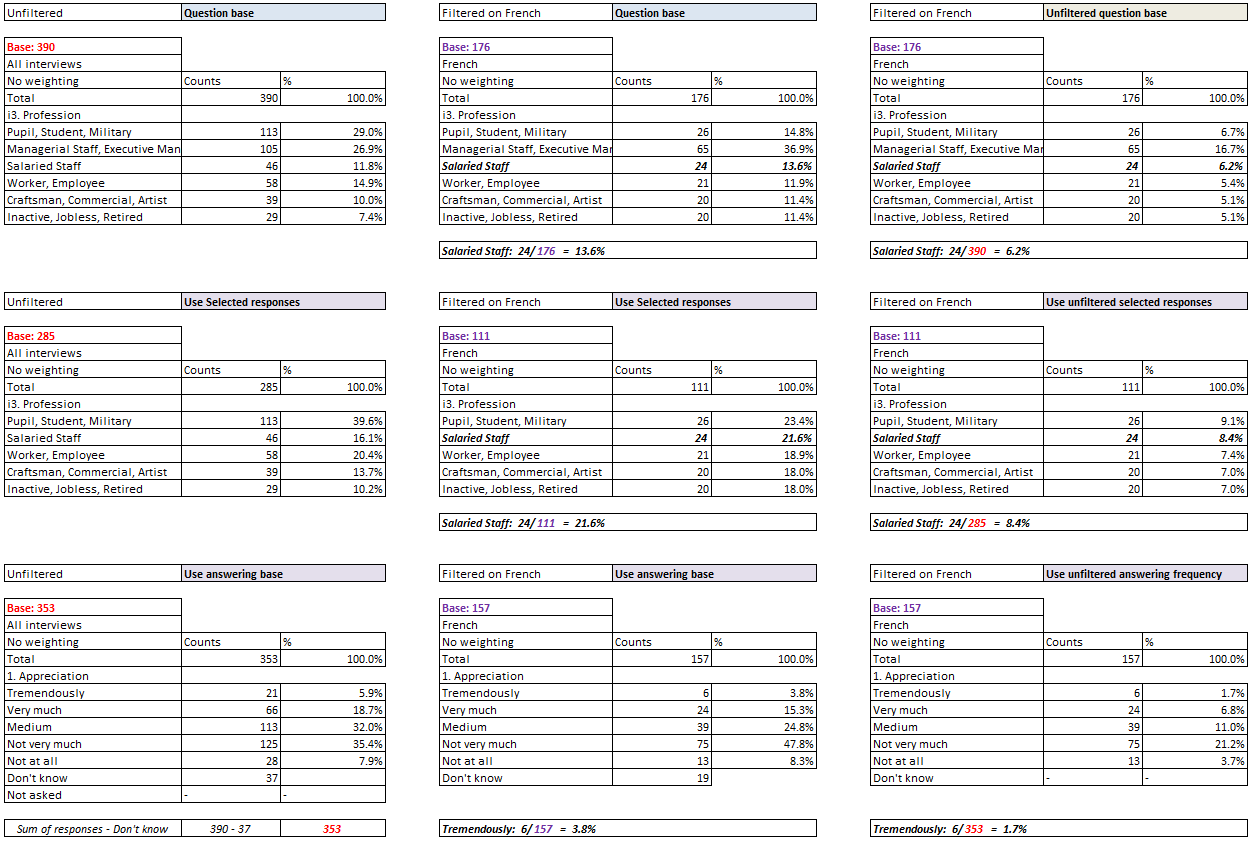
You can simply say: The counts are filtered but the number we divide by in order to calculate the % is not filtered.
Now the least intuitive ones - these shouldn't be thought of universes in exactly the same sense as those discussed above, but their behaviour is a bit different.
- Question table base - shows all counts in the total row for those entering the question table (loop) - 92 for each column in the example in the dev ticket below.
- All interviews for question table - shows all counts in the total row for all interviews - 100 for each column in the example in the dev ticket. Always the total number of respondents in your survey file.
The background to why these were introduced is explained here: https://dev.askia.com/issues/6115.
It was basically because there was a back compatibility issue for data exports when changing from legacy SQL format to new SQL format. There was a change to the numbers displayed in loop questions - they went from every code of a loop showing counts for all respondents, to showing counts for only those answering that iteration. It saves a lot of space in the data file this way!
The introduction of these new universes was to make new SQL format data appear as legacy SQL format data in tables.