Mean Summary Tables in AskiaAnalyse
| Summary | This document provides examples and explanations of how to set up calculations in AskiaAnalyse which will create a mean or sum summary table. There is also an introduction to script formatting and advanced sorting for such calculations. |
| Applies to | AskiaAnalyse |
| Written for | Data Processors and Analysts |
| Keywords | Summary table; mean; sum; script formatting; scripts 2.0; tab template; general tab; calculations; number formatting; script; advanced sort; scaled values; |
This article describes how to create a mean summary table in Analyse. We will use the attached Mean Summary.qes and Summary Portfolio.xml in the examples demonstrated. These can be downloaded here.
Whilst the central theme of this article is Mean Summary Tables, there will also be useful examples on Script (sum), Script formatting and Advanced sort on Script (mean).
So let’s review the set-up we have in the Mean Summary.qes file.
There are three small business brands (A, B & C) in the brands variable and six retail sectors which these brands sell across in the sectors variable. We track their spend & income across these sectors in the variables of the same name.
The first requirement is to create a table of brands in the columns and sectors in the rows and to show the mean spend in pounds for each brand by sector.
We do this in the following way:
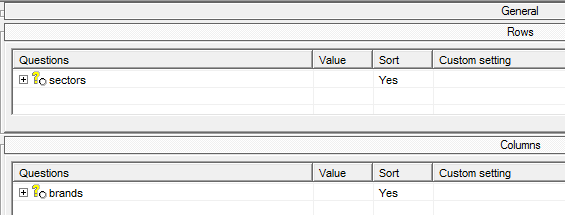
Put the variables into the rows and columns as follows:
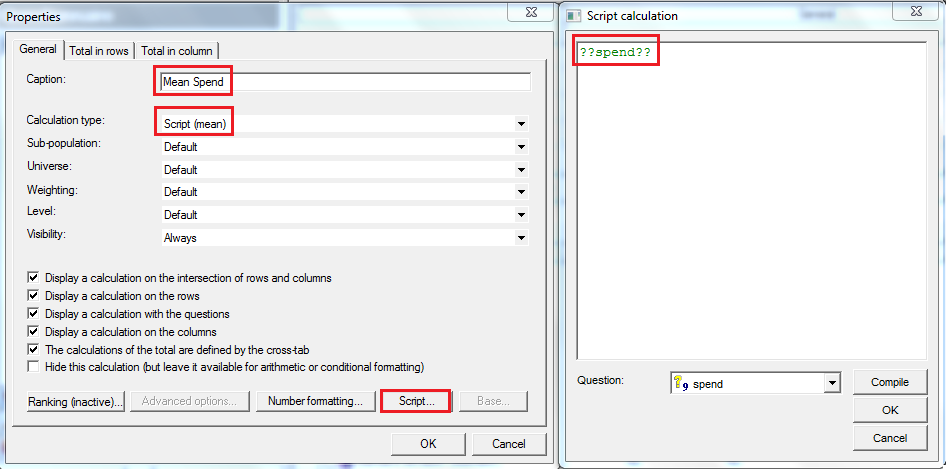
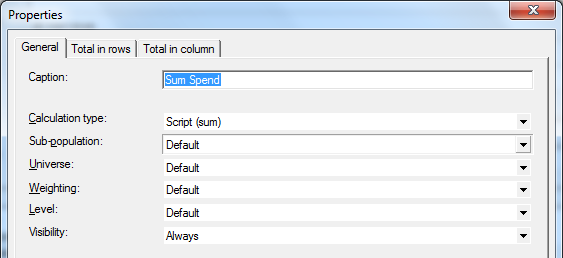
Insert a calculation on Script (mean); give it a sensible name and in the script, declare the variable which should have its mean calculated.
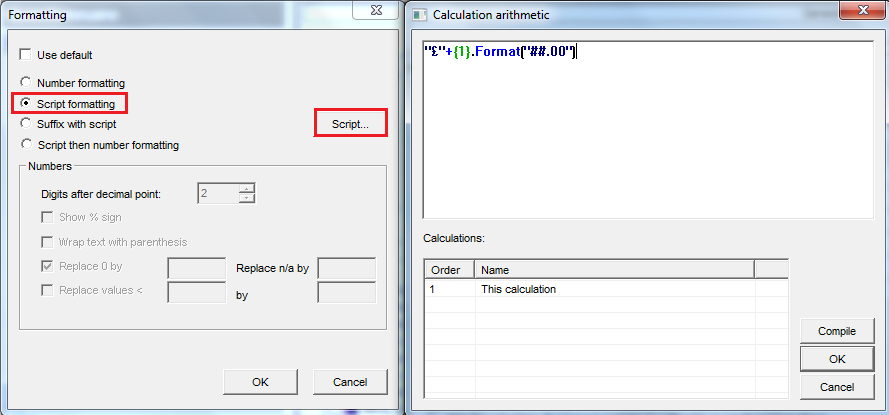
Under Number formatting, the number of decimal places can be changed from the default set in the tab settings. For now, we need this to show the £ sign. Number formatting > un-tick ‘Use default’ > select ‘Script formatting’ and enter the script as below:
Below, in the formatting script, we can use {1}.Format("##.00") to simply keep the output, after formatting, to two decimal places. We use "£"+ to prepend the pound sign.
"£"+{1}.Format("##.00")
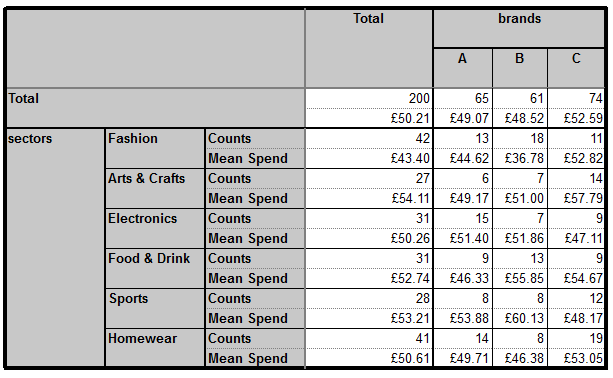
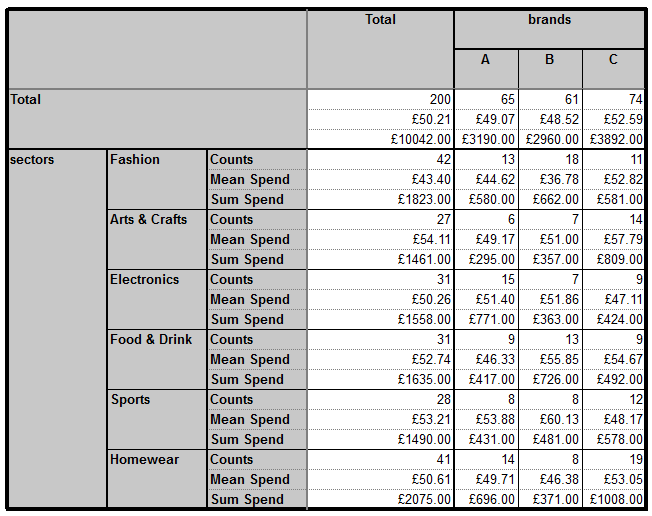
Which gives us the following:
In the next table, the requirement is to show the Sum Spend Summary with the pound sign and also, (knowing the default is to include commas as thousand separators), to ensure that there are no commas included in the output figure.
i.e. A thousand pounds is displayed as £1000 and not £1,000.
So right-click in the calculations of the general tab > Insert > select ‘Script (sum)’ and name the calculation accordingly.
Set up the script formatting as follows:
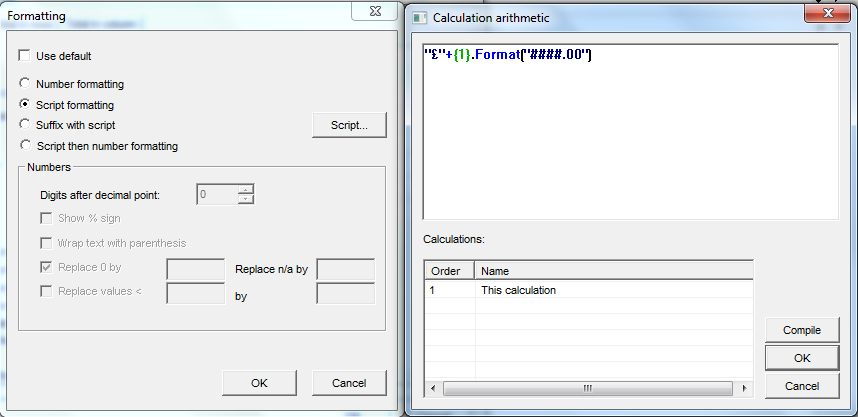
So in this case we see that we can remove commas as the thousand separator by using the below:
"£"+{1}.Format("####.00")
But what would we use in case we wanted the opposite? i.e. by default, the commas were not included and we want to force their inclusion as the thousand separator. In that case we can use the below.
"£"+{1}.Format("#,###.00")
Here, if the default is to display £1000, it will override that and show £1,000.
In fact there are many number formatting options explained in the Askia Design online assistant here: http://www.askia.com/Downloads/Assistant/AskiaDesign_en/.
Simply search for ‘Number formatting’.
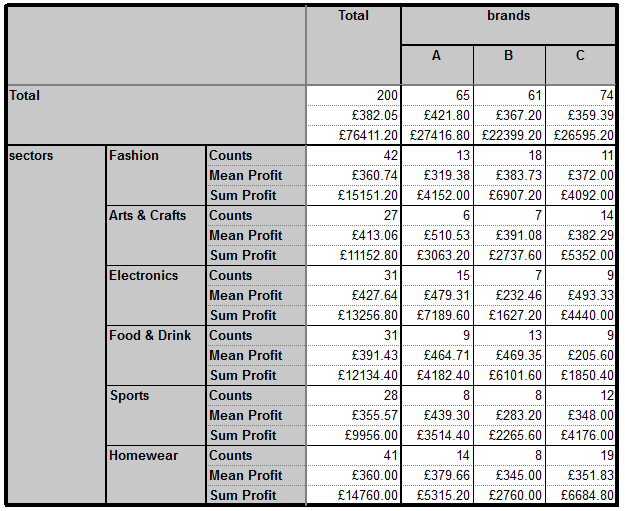
Our resulting table is as follows:
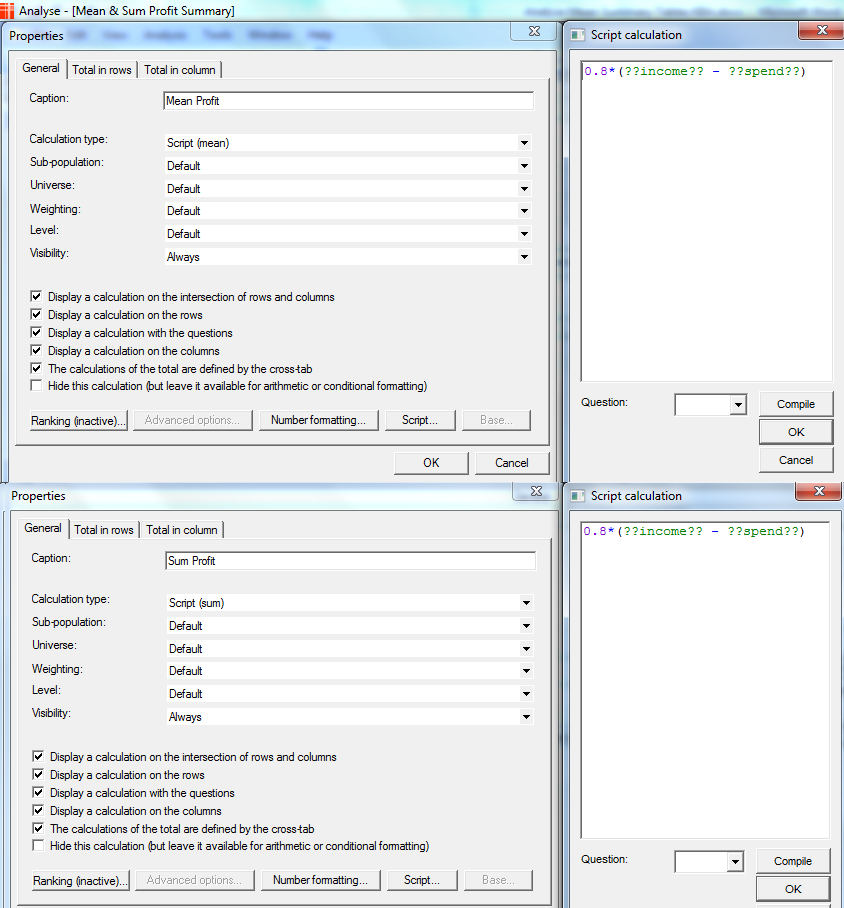
Imagine we have another requirement which is to do this for a ‘Profit’ calculation where profit is defined as:
80% of (Income – Spend)
We would set up our calculations as follows:
And this would give us our final table:
It’s a common request to be able to sort such a table, so how would we go about doing this?
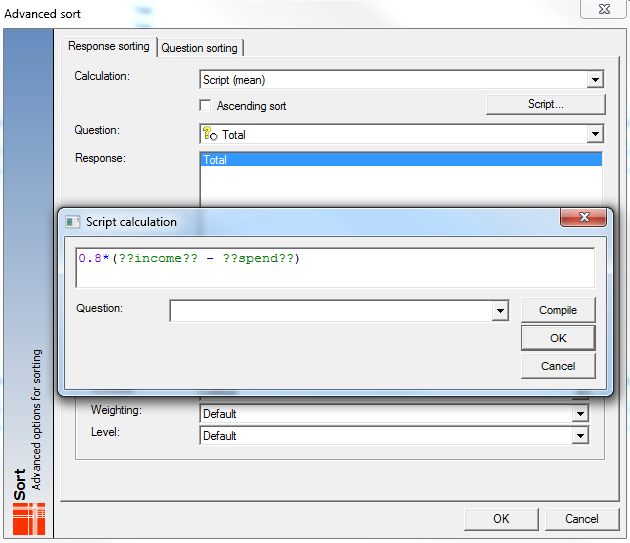
If, for example, the request is to sort mean profit for the total column we do the following:
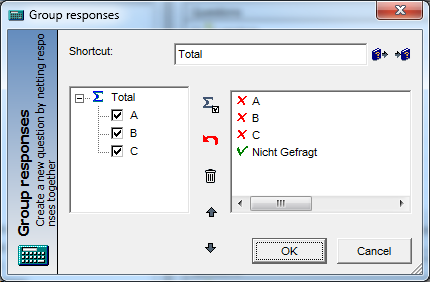
Find / create a variable which has a code containing the total base of your table (See Total variable):
Now in your rows right click > advanced sort and set-up as follows:
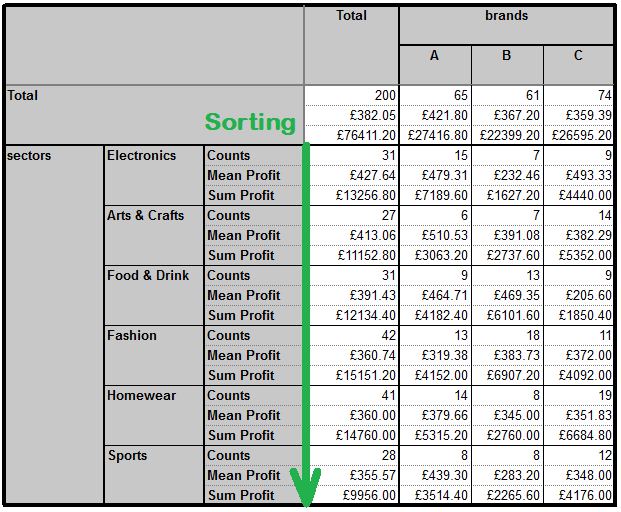
Hit the results and you will see the following:
Until now we have been looking at summary tables using numeric variables, but it’s very common to have closed rating questions which have scaled values applied.
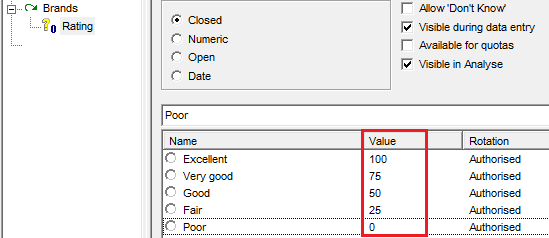
So how do we go about creating a mean summary table for this closed question and its scaled values, say, 100, 75, 50, 25, 0?
Have a look at portfolio chapter 5 (Mean Summary for Scaled Values) . . .
In this set-up there is only one variable in the rows: Brands.
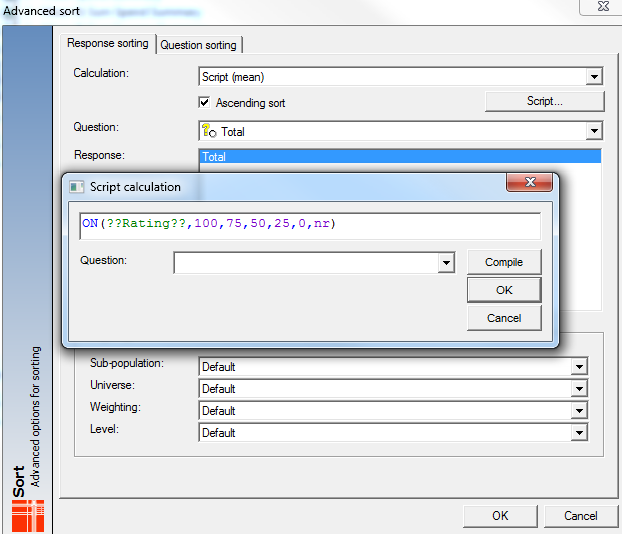
We want to display a summary table of means at the Rating question – we do this by inserting a Script (mean) calculation and setting the script to be:
ON(??Rating??,100,75,50,25,0,nr)

This is basically saying:
For those selecting the first code of Rating, set their values to be 100.
For those selecting the second code of Rating, set their values to be 75.
For those selecting the third code of Rating, set their values to be 50.
and so on . . .
This gives Table A below which gives the same results as a conventional summary table for these variables with no scripts involved. 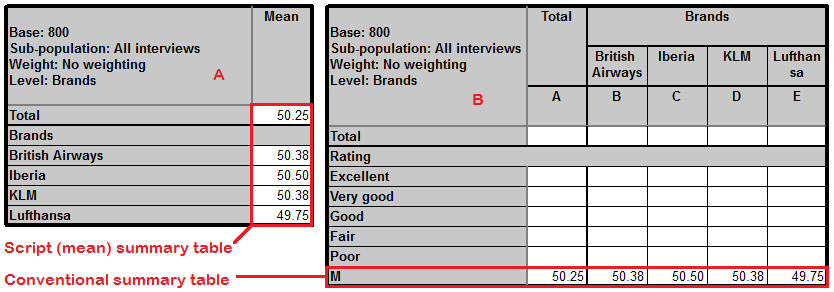
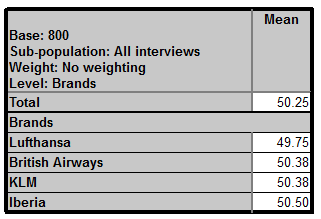
The final request at this point is to sort on the mean. You can set it up as below. Note this time I have selected ‘Ascending sort’:
The results are as follows:
If you would like a printable version of this knowledge base article then it is attached as Word document or available for download here.